Iran and COVID-19: The Unfolding of
a Humanitarian Disaster
Vahid S. Bokharaie
March 24, 2020
Update on March 29, 2020: Added Section 5.
PDF version of this report can be found in here.
Summary of the Report
In the following report, using a model adapted to real-world data of the spread
of COVID-19, it is shown that if COVID-19 is spread in Iran without
any containment policy, which is more or less the case at the moment
of writing this text, it can lead to disastrous consequences. Although
the reports show that the current situation in Iran is already very bad,
simulations show that the worse is yet to come. The peak number of
infected people in Iran will probably happen in 1.5-2 months from now.
Simulations show that in an uncontained human population with the age
structure of the Iranian population, at the peak of the infection, around
11% of the population will be infected simultaneously. And eventually,
65% of the population will be infected. For a country as big as Iran,
these peak values might reach in different days in different cities or
regions. But all are expected to reach these peak values days or weeks
apart. If we assume only 5% of those infected with COVID-19 need
respiratory or intensive care, the total number of hospital beds needed
at the peak of the epidemic in Iran is around 467, 000 beds. Also, in
the uncontained scenario, eventually 65% of the population will be
infected with COVID-19 in a matter of months, which is around 55 million
people for a country of around 85 million inhabitants. Even with a
mortality rate of 0.2%, which admittedly is optimistic for such a huge
number of potential patients, total death would amount to around 110, 000
people.
To avoid such an unprecedented disaster, there is an immediate
need to implement effective containment strategies. I have presented a
detailed quantitative analysis of the effectiveness of various containment
policies. The most effective, among the ones humanly possible, is a total
lock-down of the population, closing down all governmental offices,
companies, banks and schools and forcing people to stay home. A policy
which is already enforced by governments in different countries around
the world. Simulations show that if such a policy is imposed today,
it can bring down the total number of infected to around 7% of the
population, down from 65%. But even in such a case, considering the current
level of the spread of the COVID-19 virus in the Iranian population,
eradicating it would take months. It needs patience and determination
and a long-term strategy to manage the number of infected people in
the population until the vaccine for COVID-19 is publicly available.
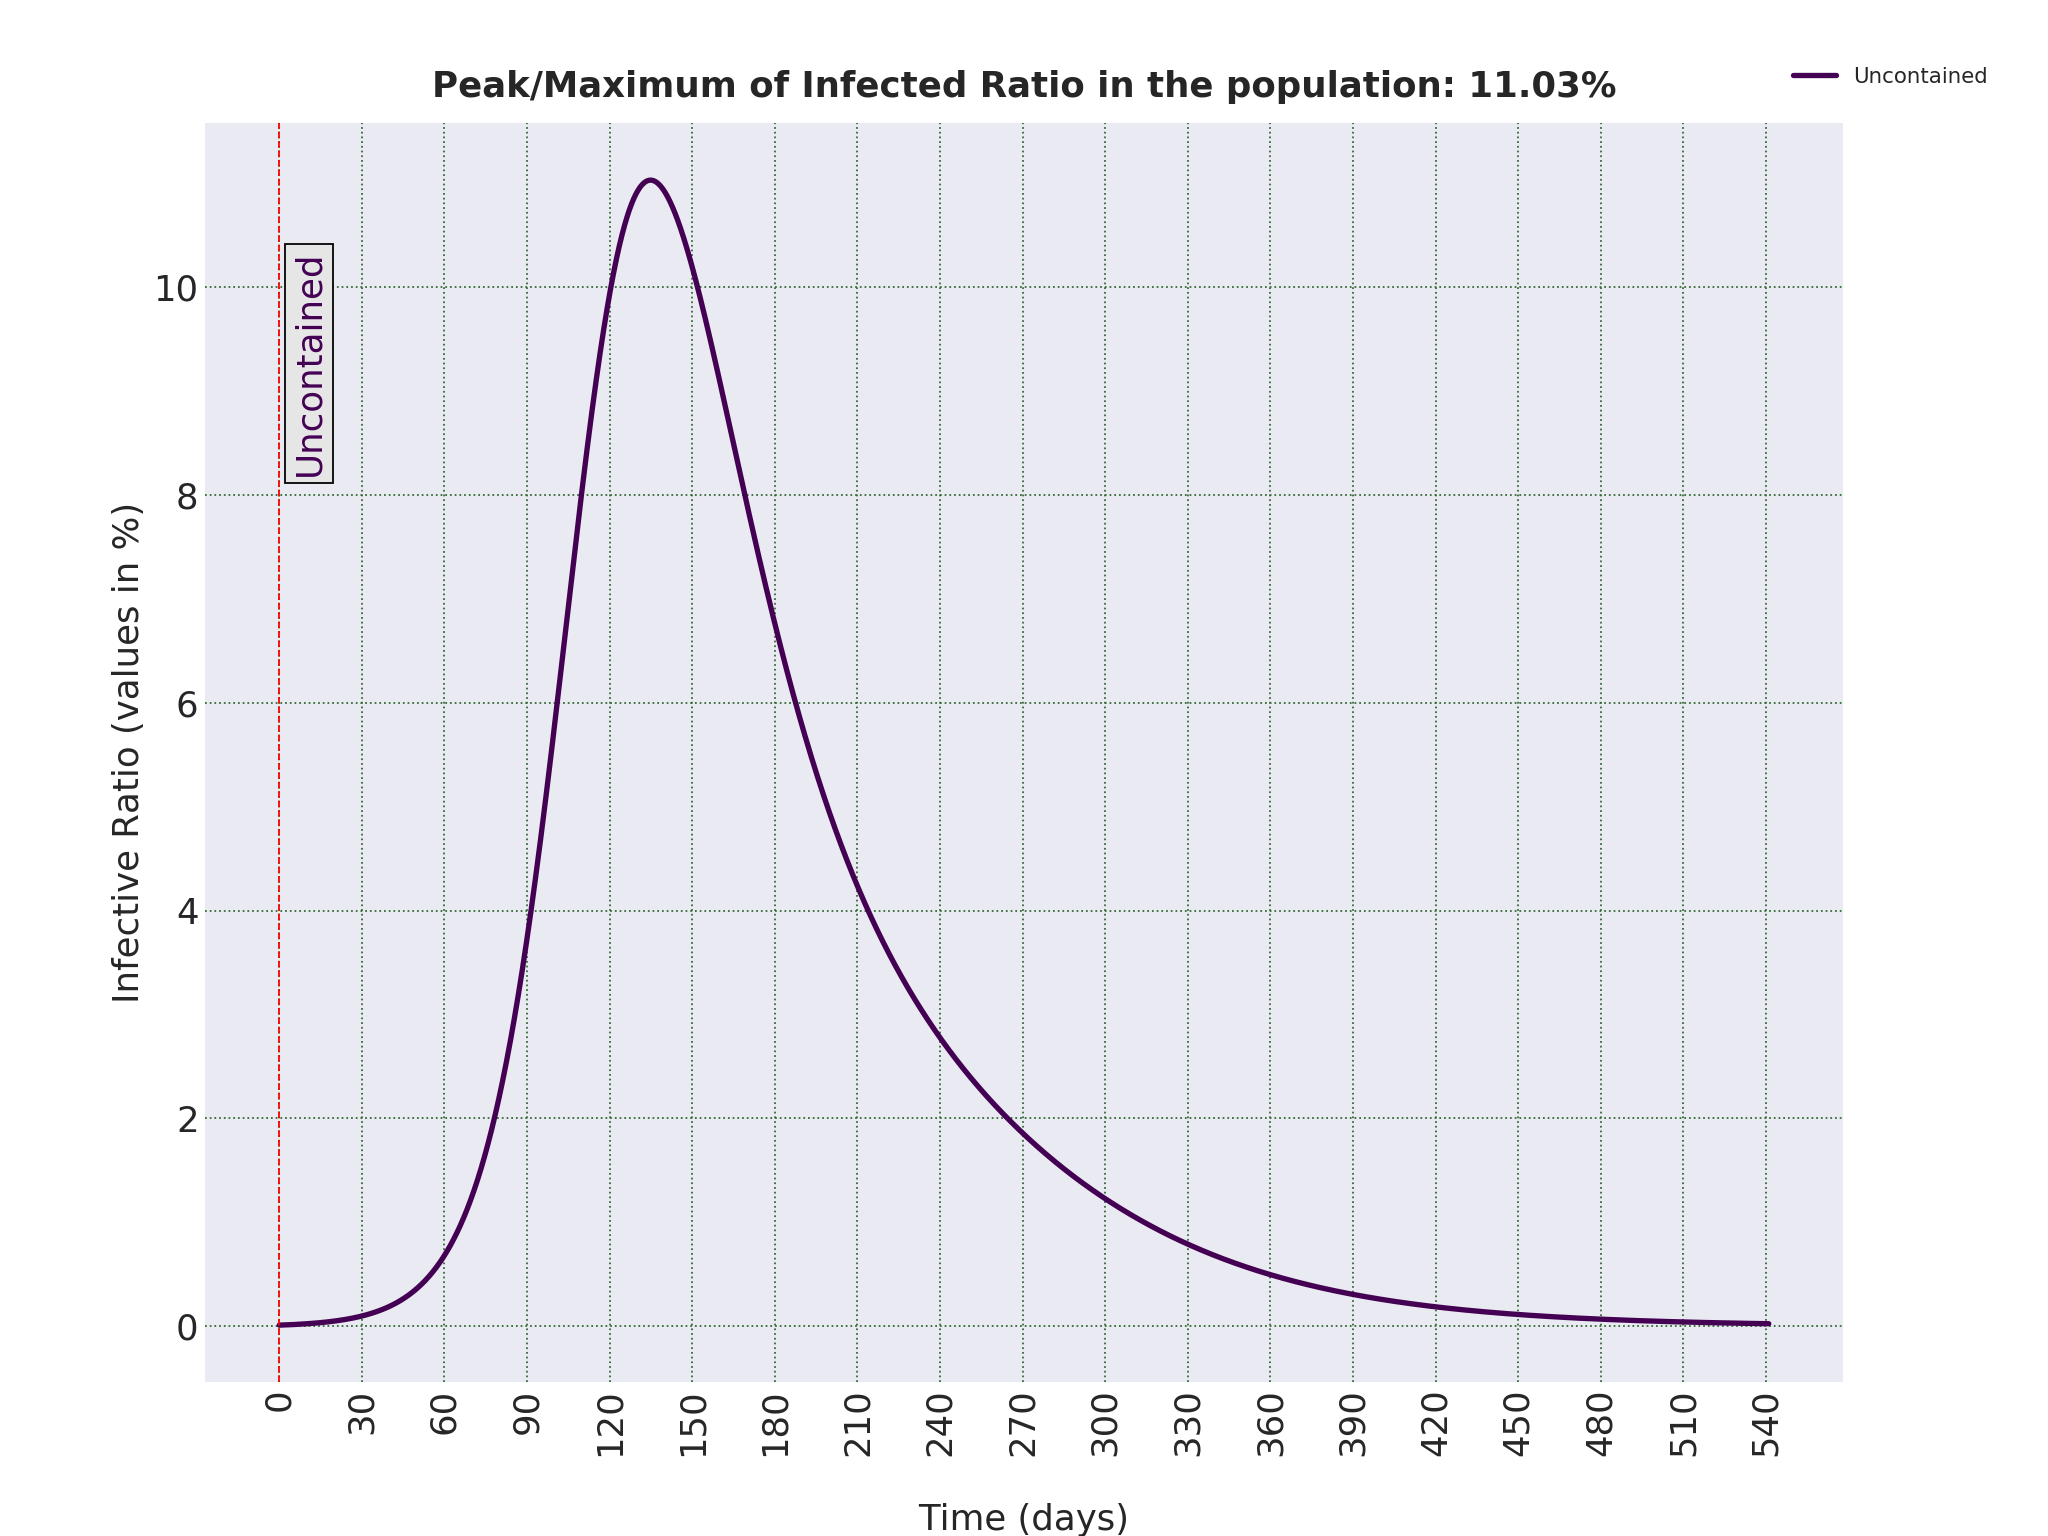
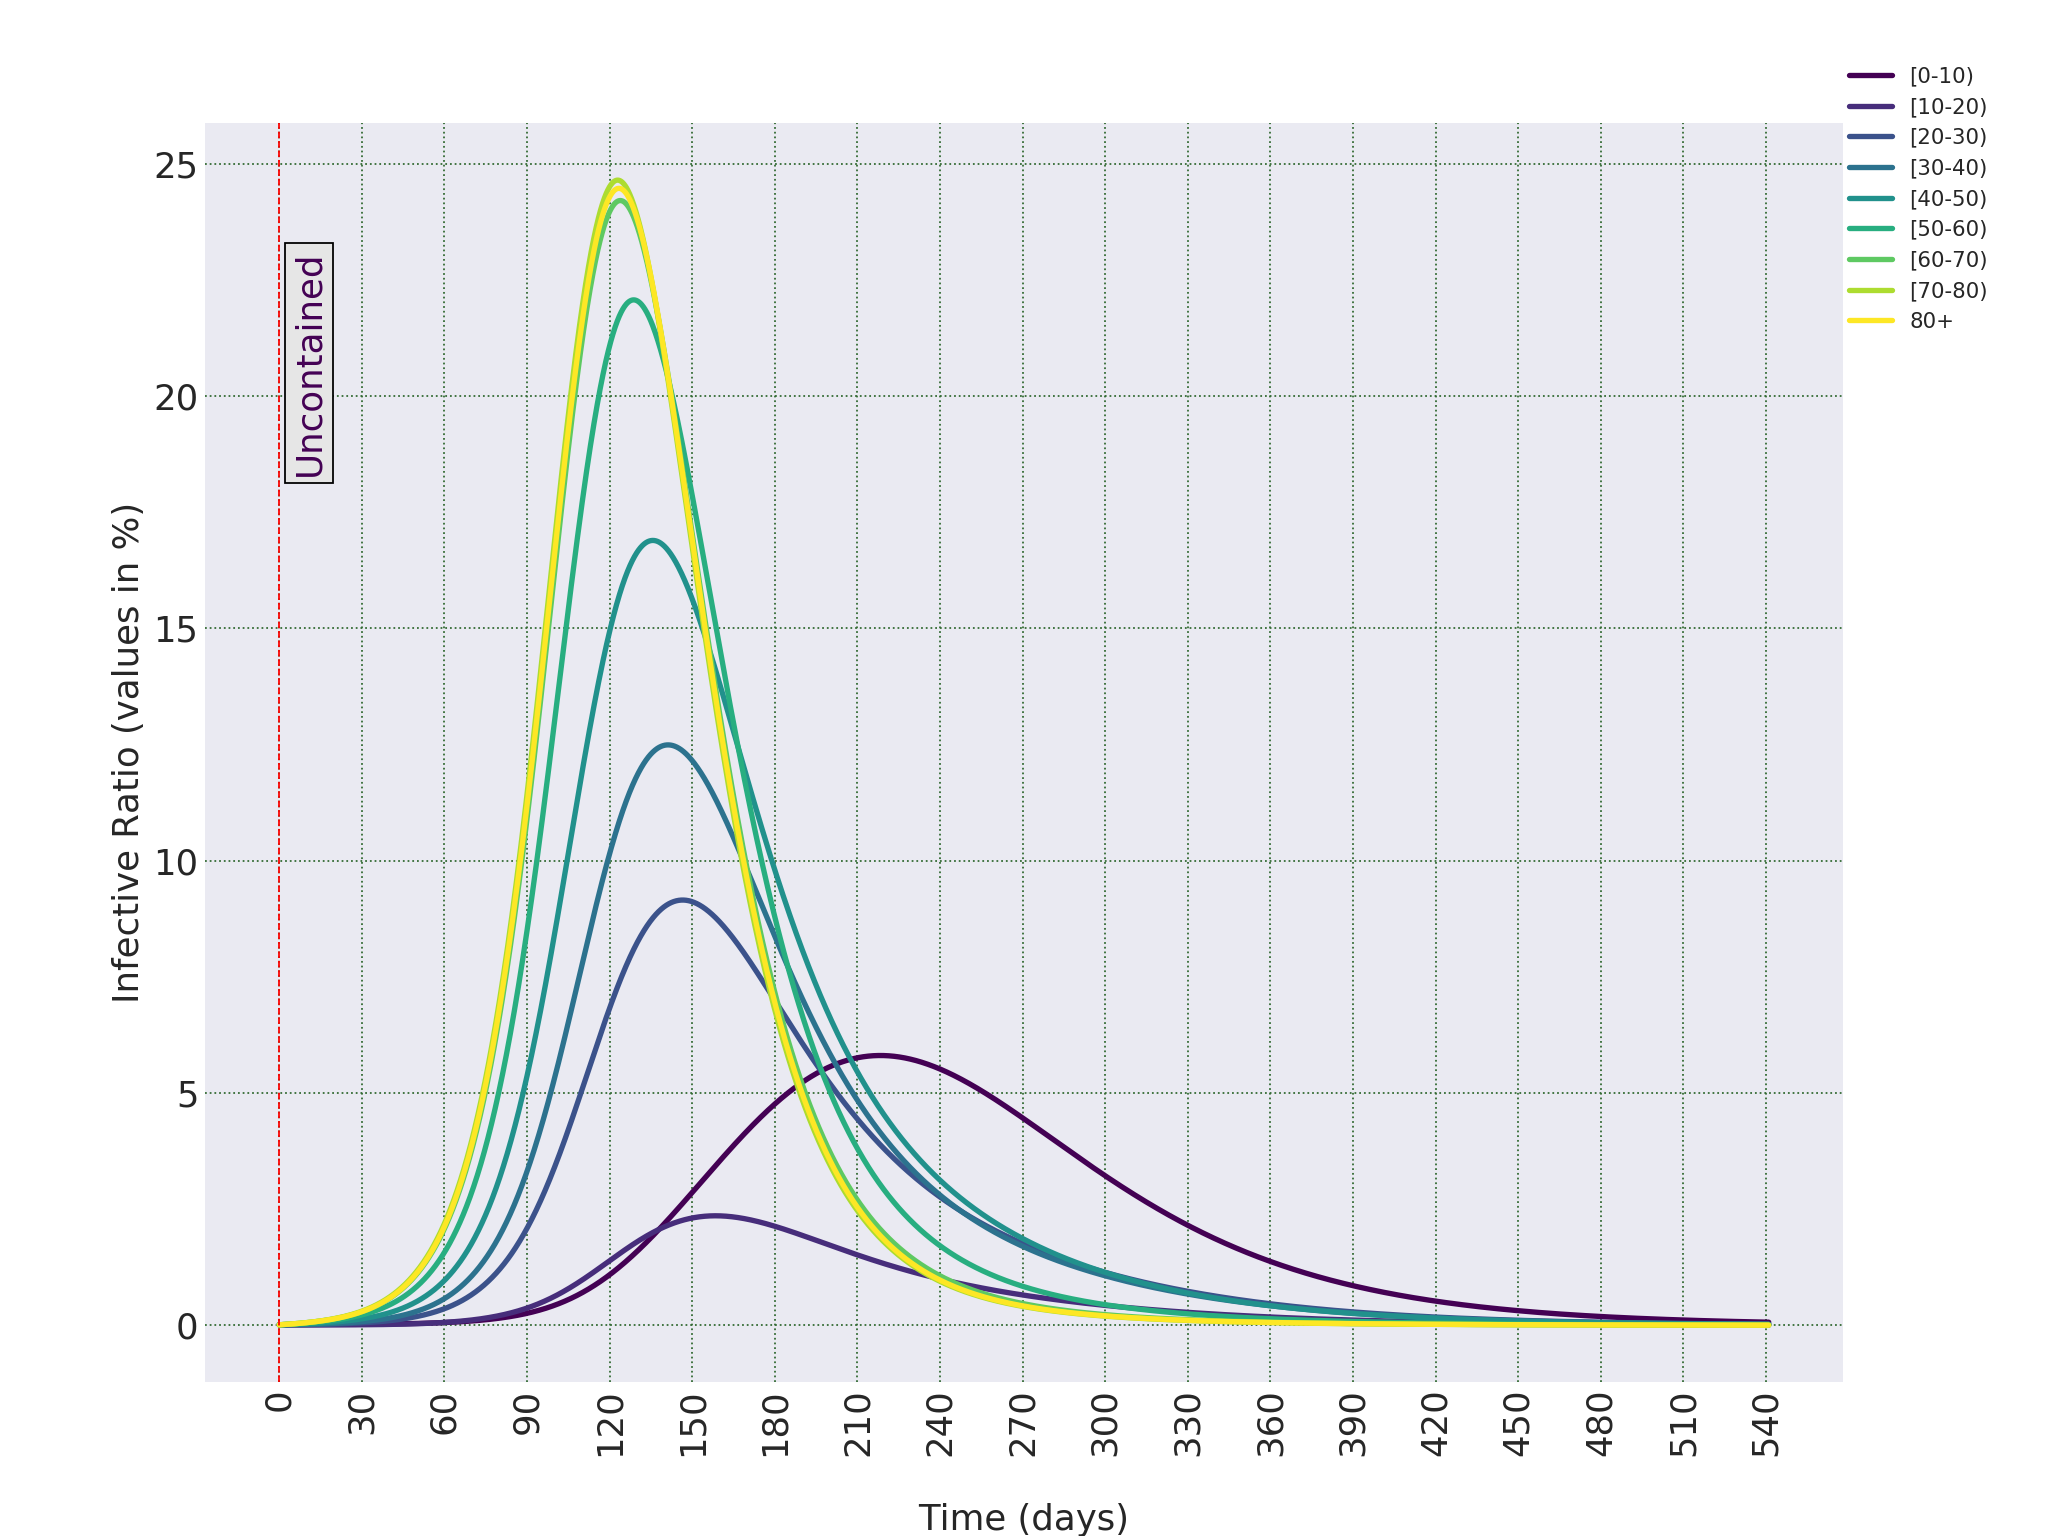
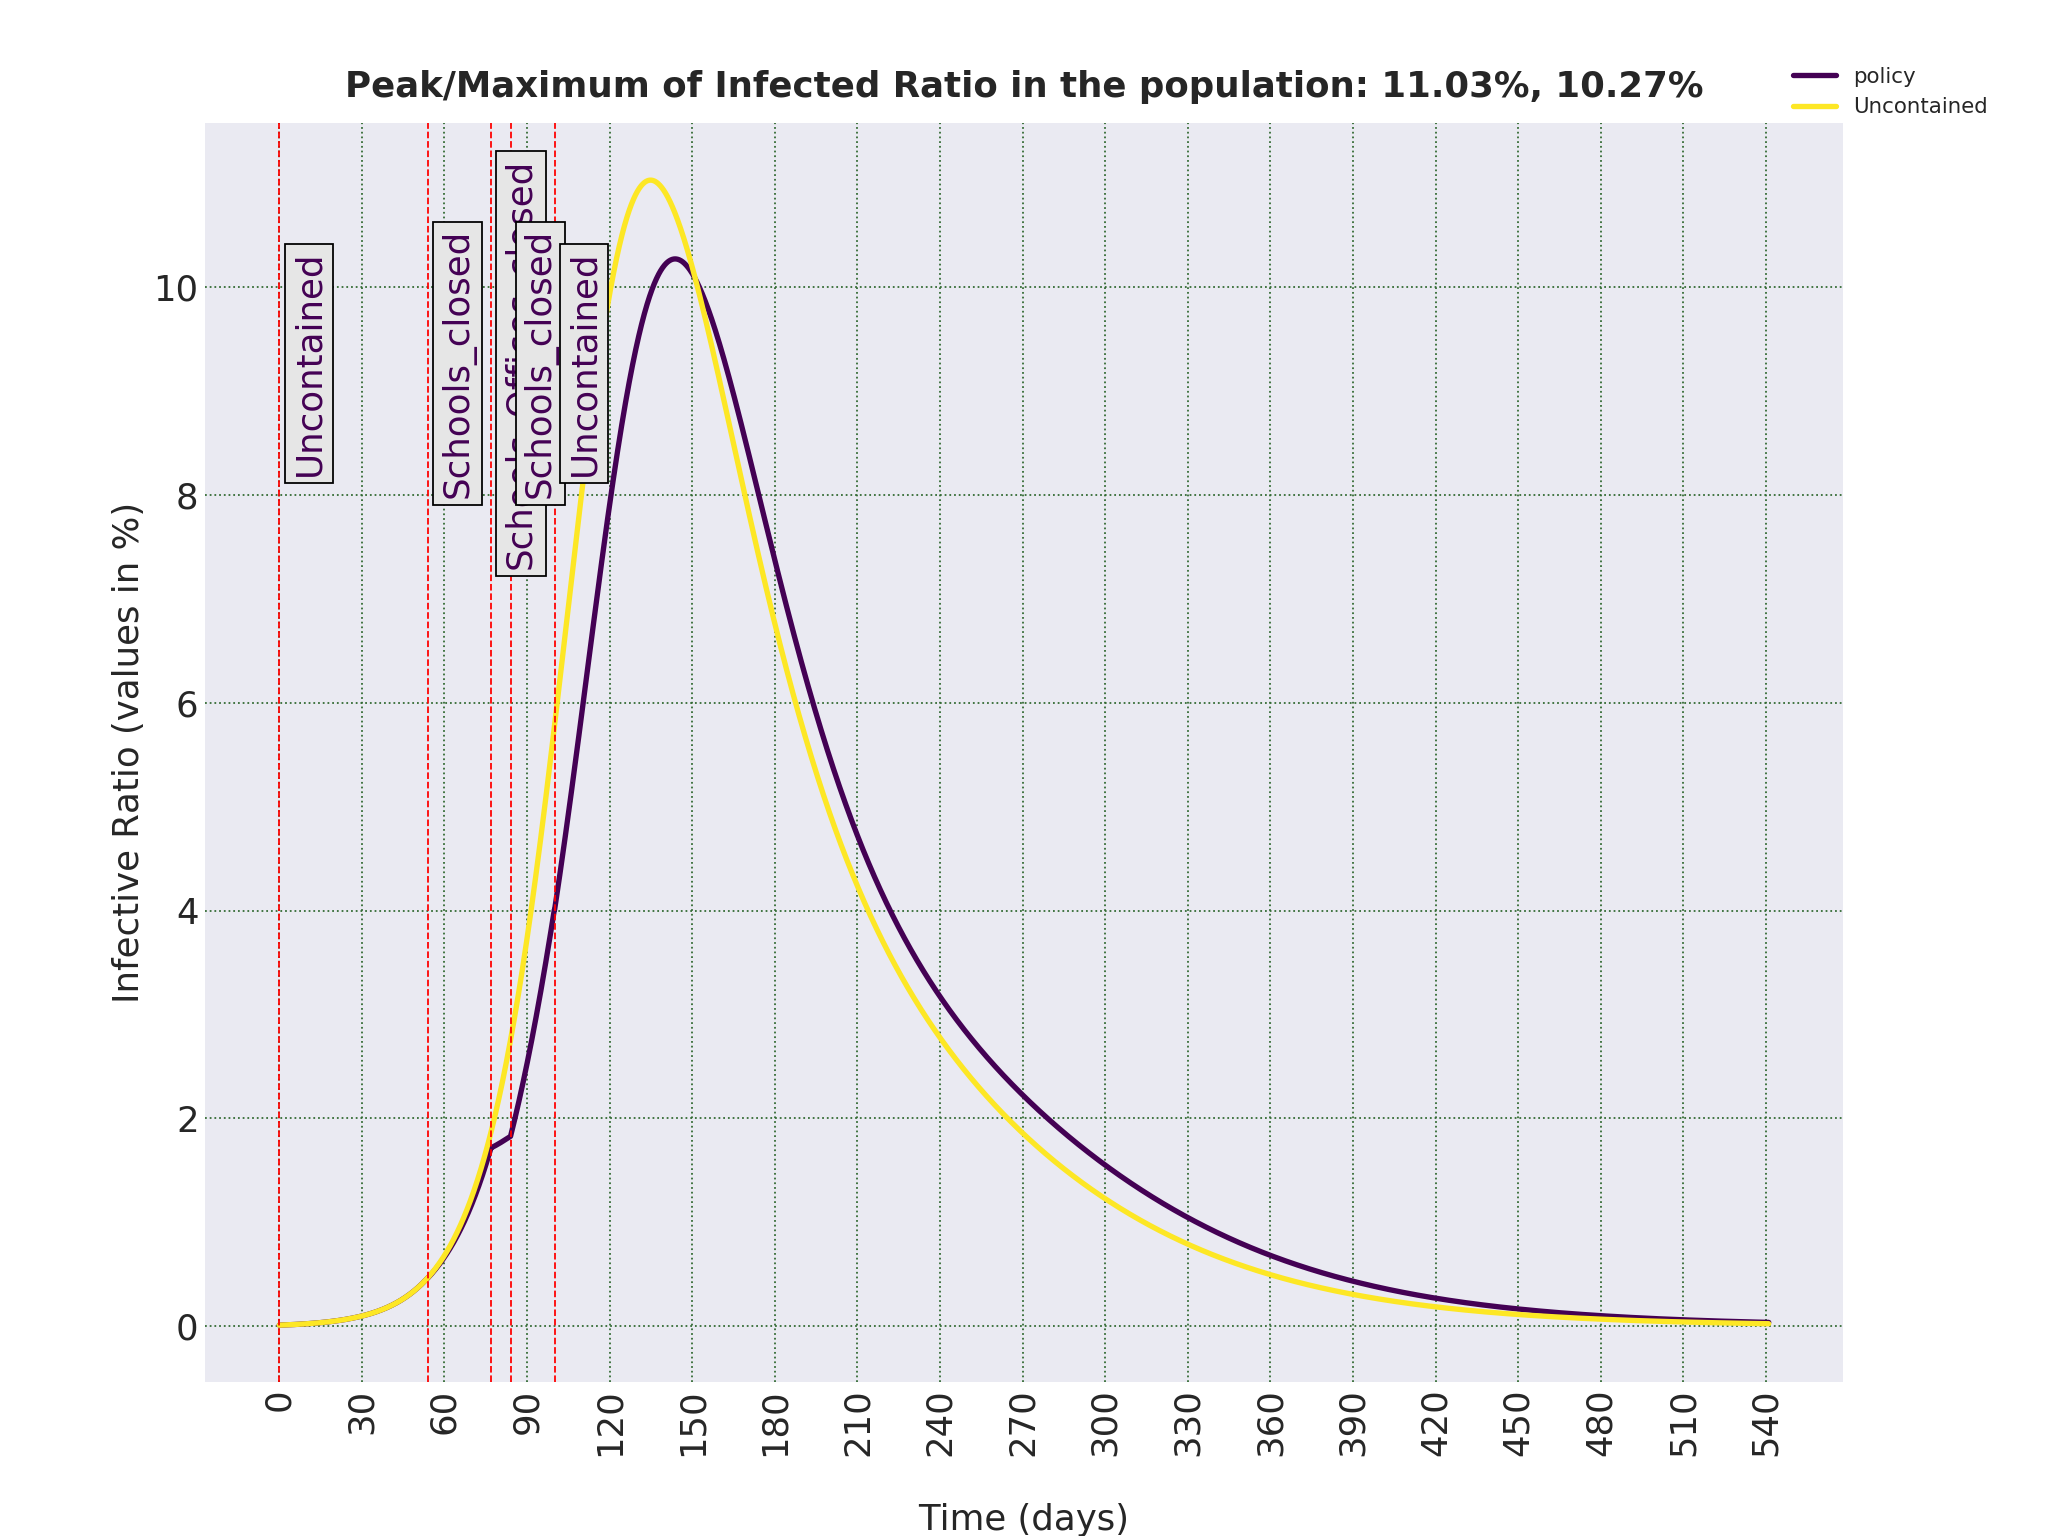
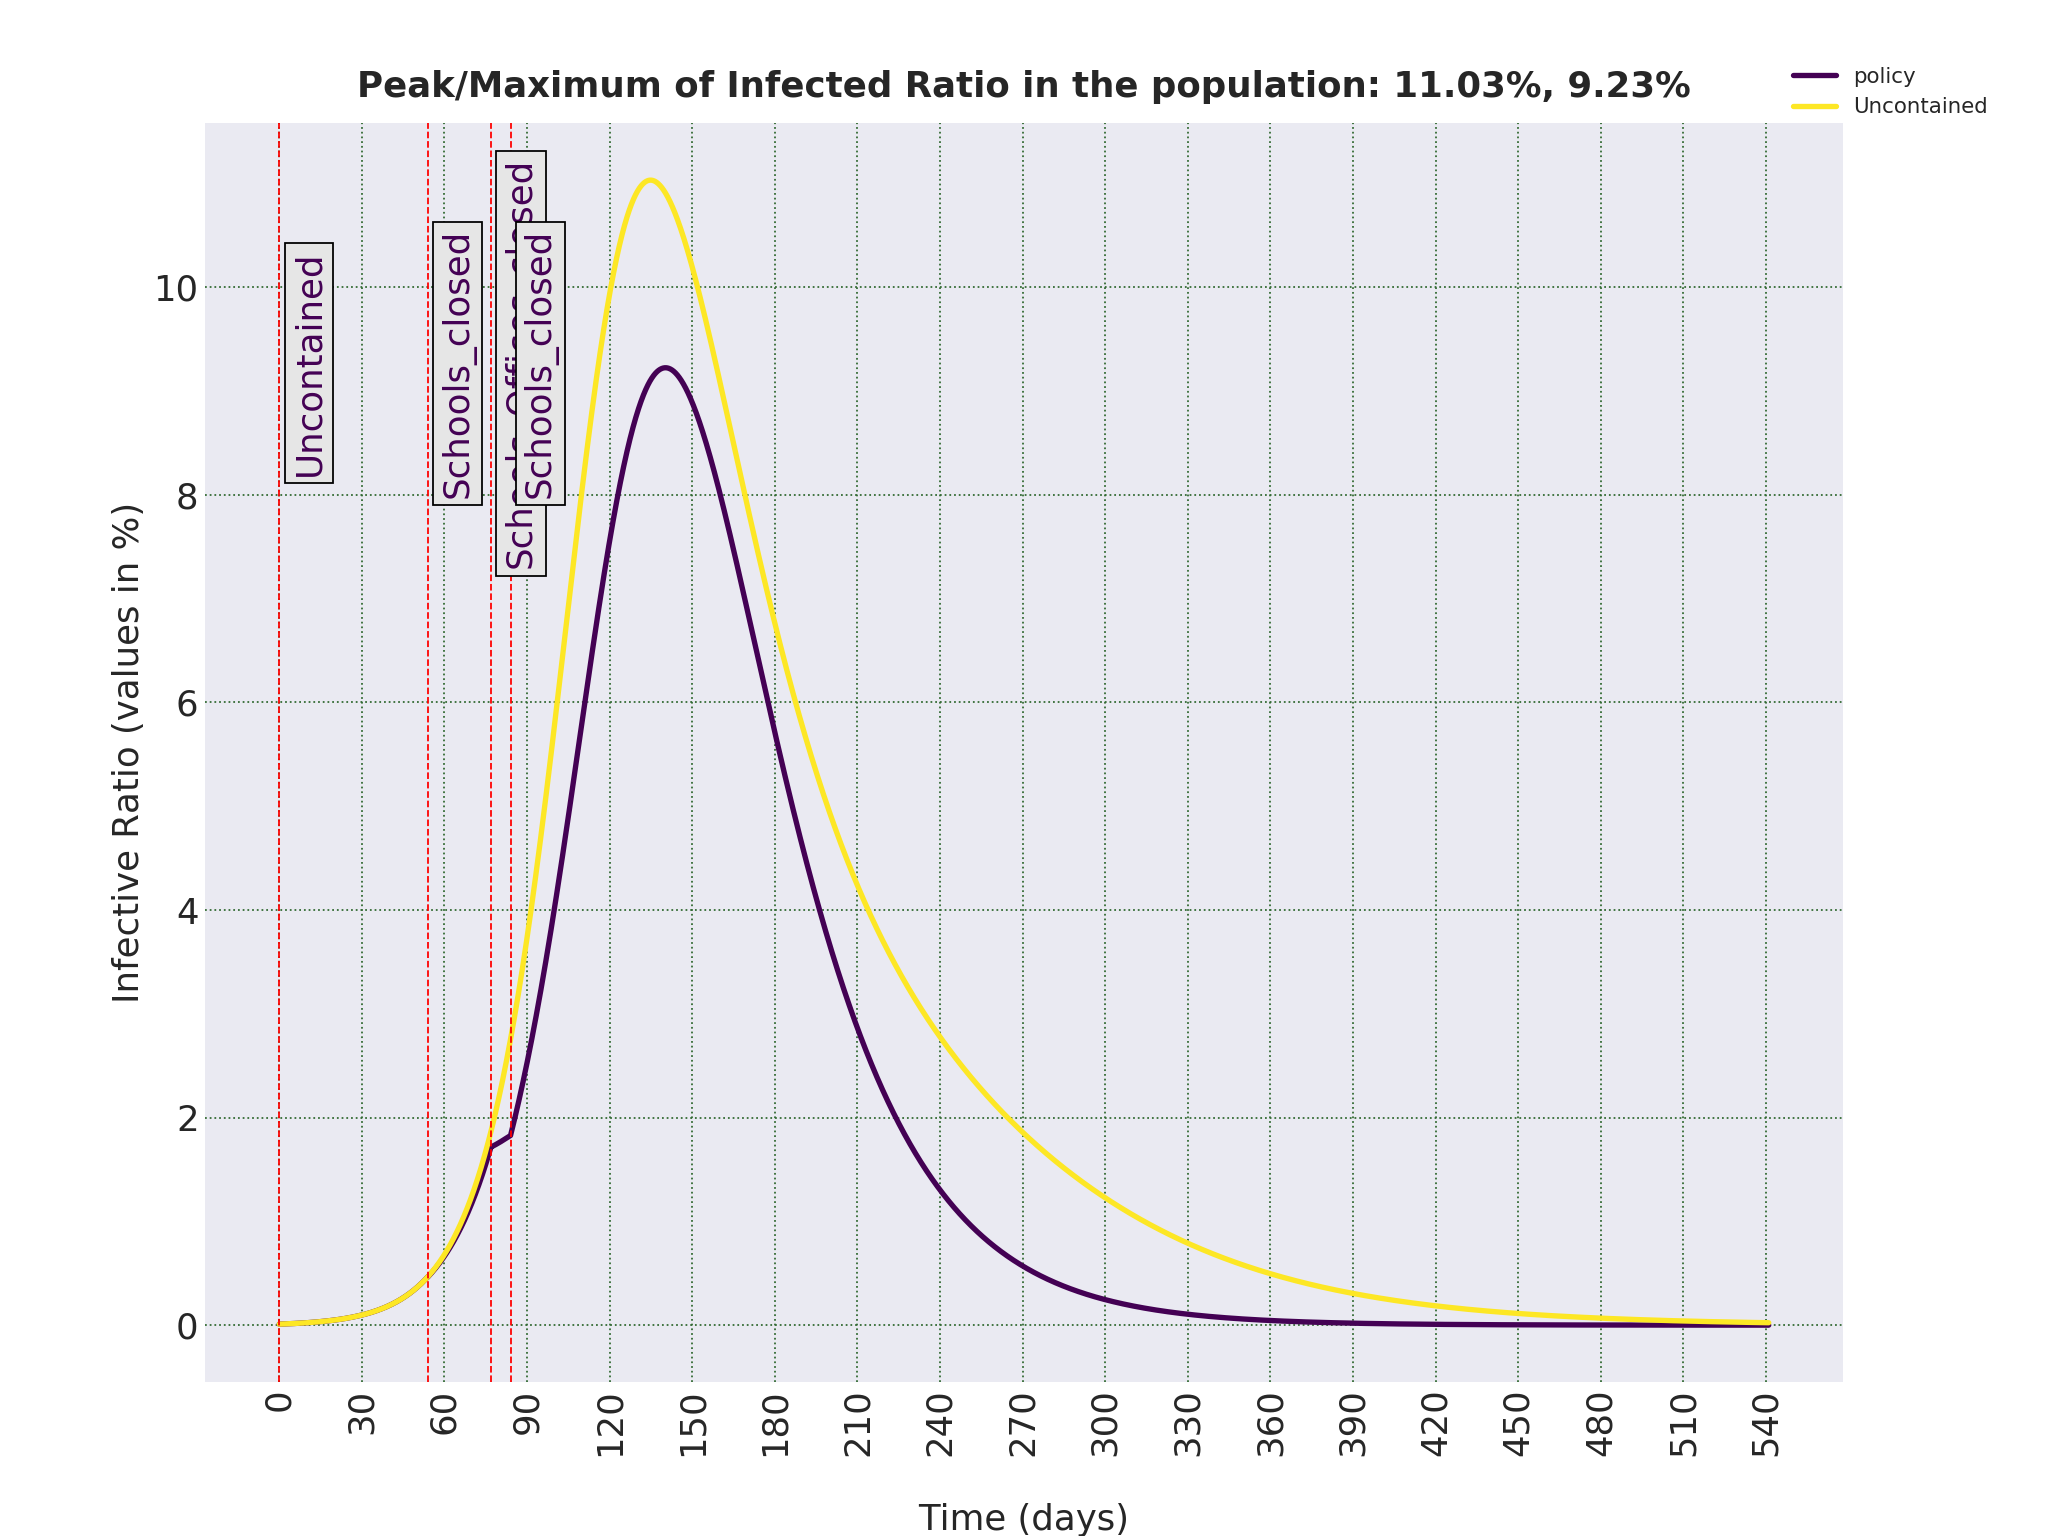
In the following simulations, I have assumed people infected with COVID-19 and then cured, have immunity to the virus. Let’s consider the case in which COVID-19 is spread uncontained in Iran, i.e. the case that people in the society interact with each other as in normal times, with no external or self-imposed restrictions in the interactions. Figure 0.1 shows how the ratio of Infectious people changes in the 18 months after the introduction of COVID-19 virus in the population. In case you are not familiar with the term Infectious, it refers to those who are infected and can also transmit the disease. For COVID-19, it seems everybody who is infected is almost immediately Infectious, so in this case they can be used interchangeably. The model can also give use the progress of the disease in age groups, as can be seen in 0.2.
Please note that the output of the mathematical model is the ratio of Infectious and Removed individuals in each age groups. Age groups are defined as as 0-10, 10-20, ..., 70-80 and 80+. Also, Day 1 in these plots falls approximately in early January, which means the time to reach the peak value of simultaneous Infectious, around 11%, is on day 135, which is 1.5-2 months from now. But this estimate for the time to peak depends on the initial conditions set for the model, which are discussed in detail in Section 2.
———————————————————————————————————————————
These two figures, can already provide a picture of the disaster in the making. The most important conclusion is that, at the peak, around 11% of the population are simultaneously infected with the virus. In this report, I mainly talk about the population of Iran as a whole. But for a country as big as Iran, it is expected that different cities or regions would reach this peak value with some time-delay with respect to each other. But the overall trajectory will be more or less the same. Even if 5% of the infected people might need respiratory or intensive care, there is a time-period of days or weeks in which around 467, 000 people in Iran might need support care in hospitals.
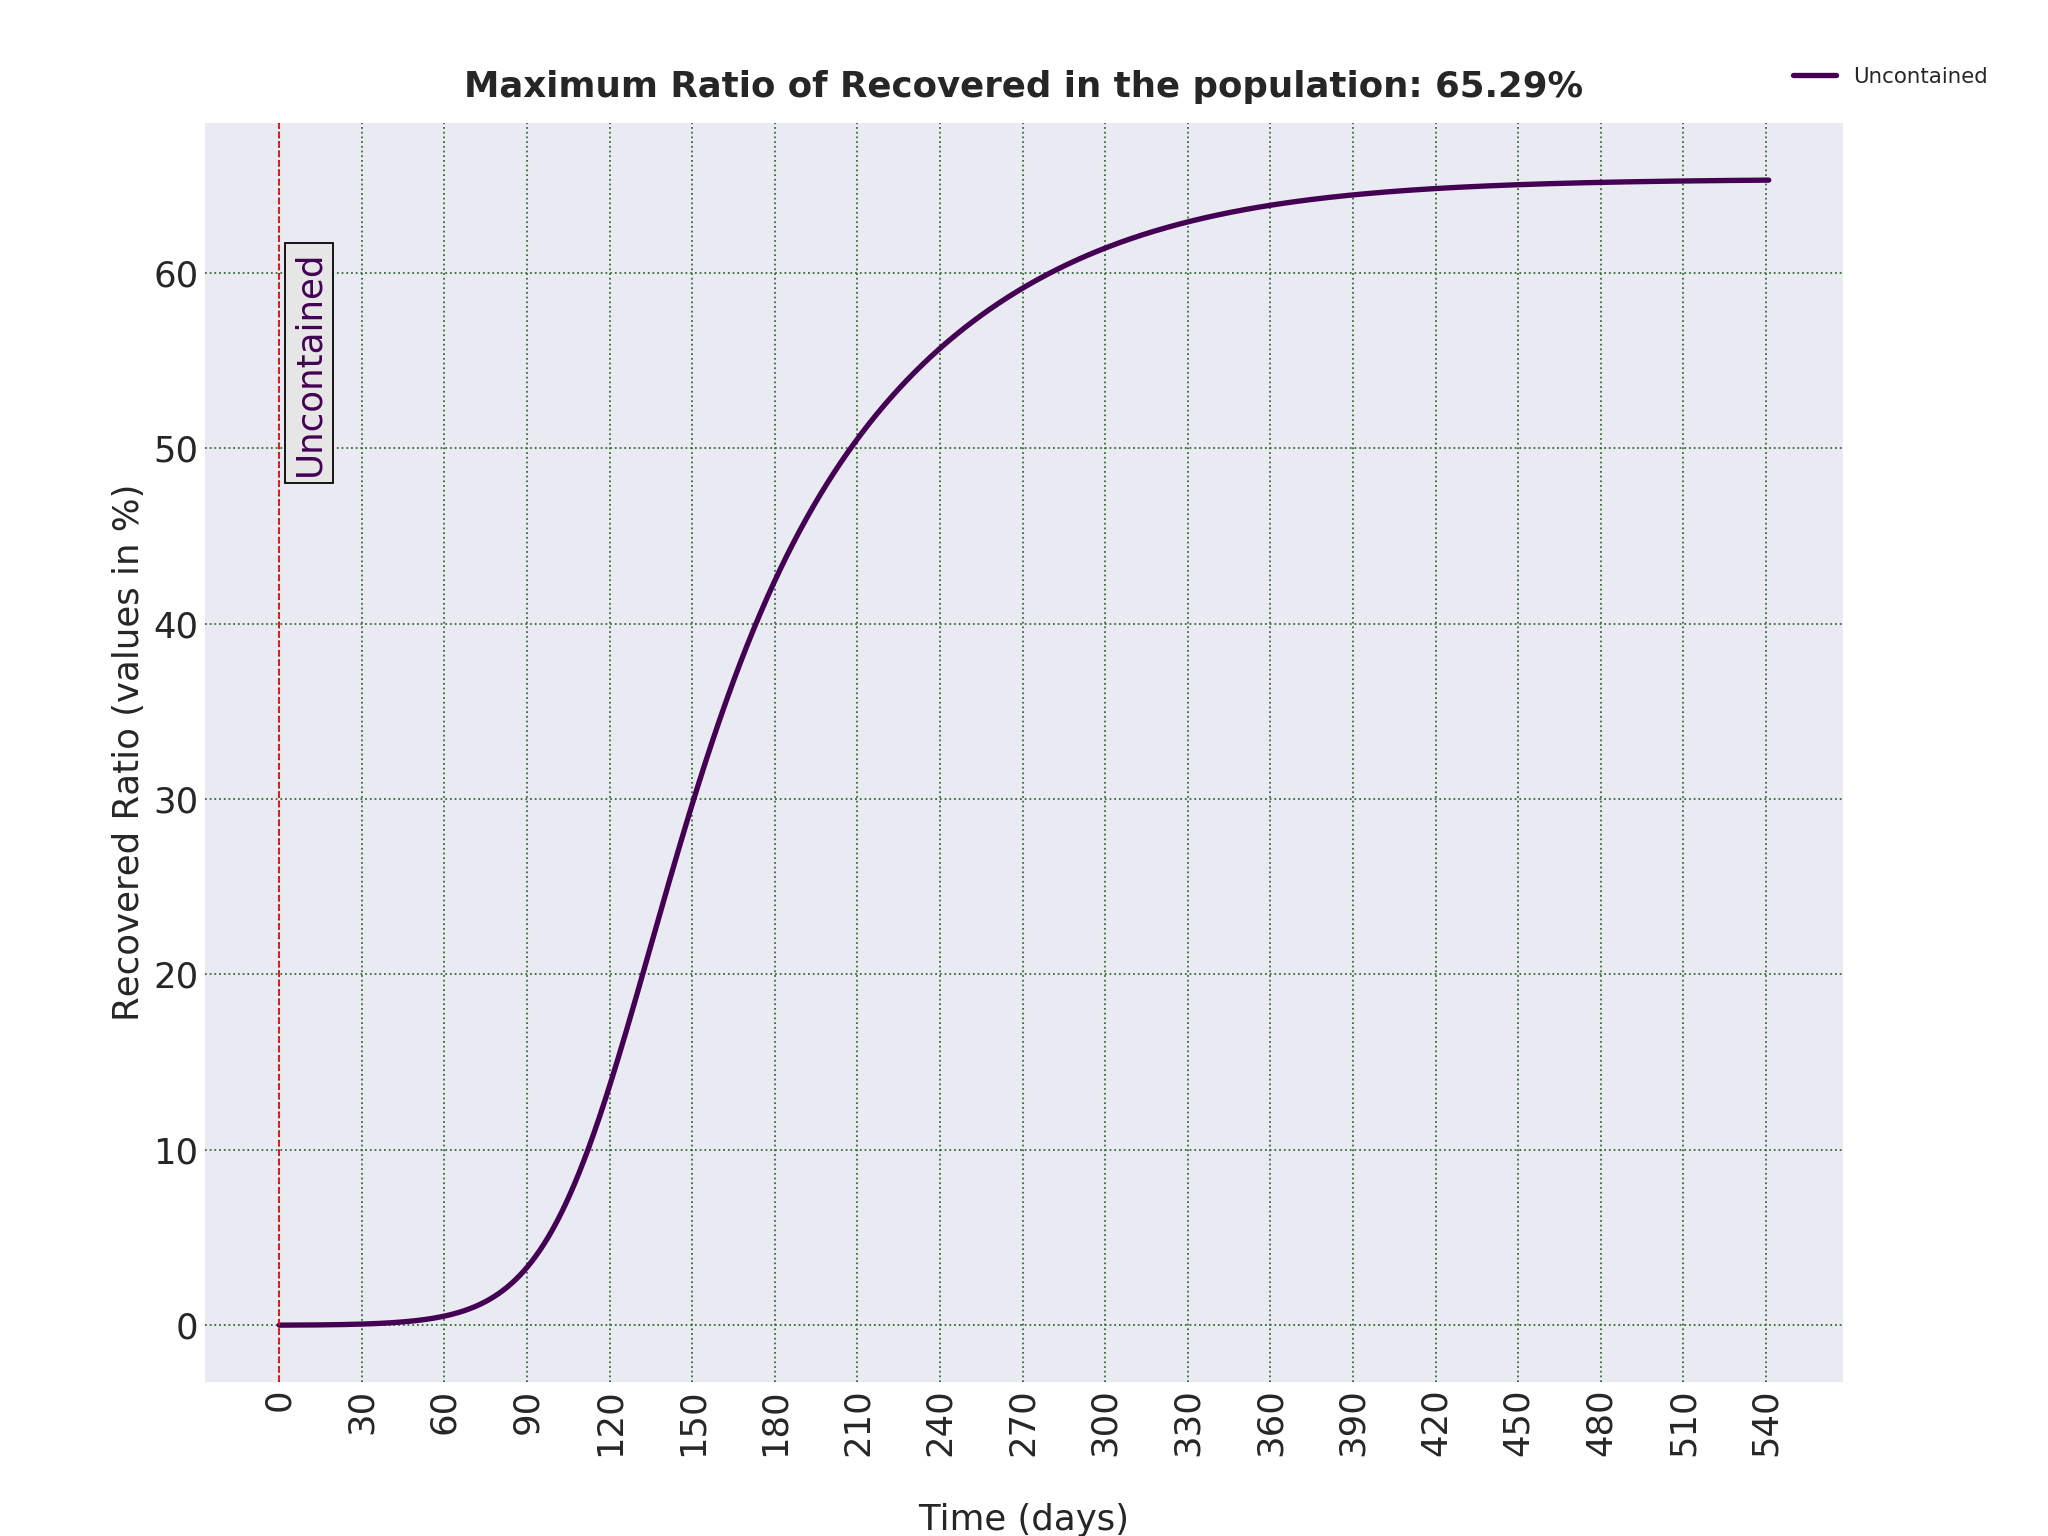
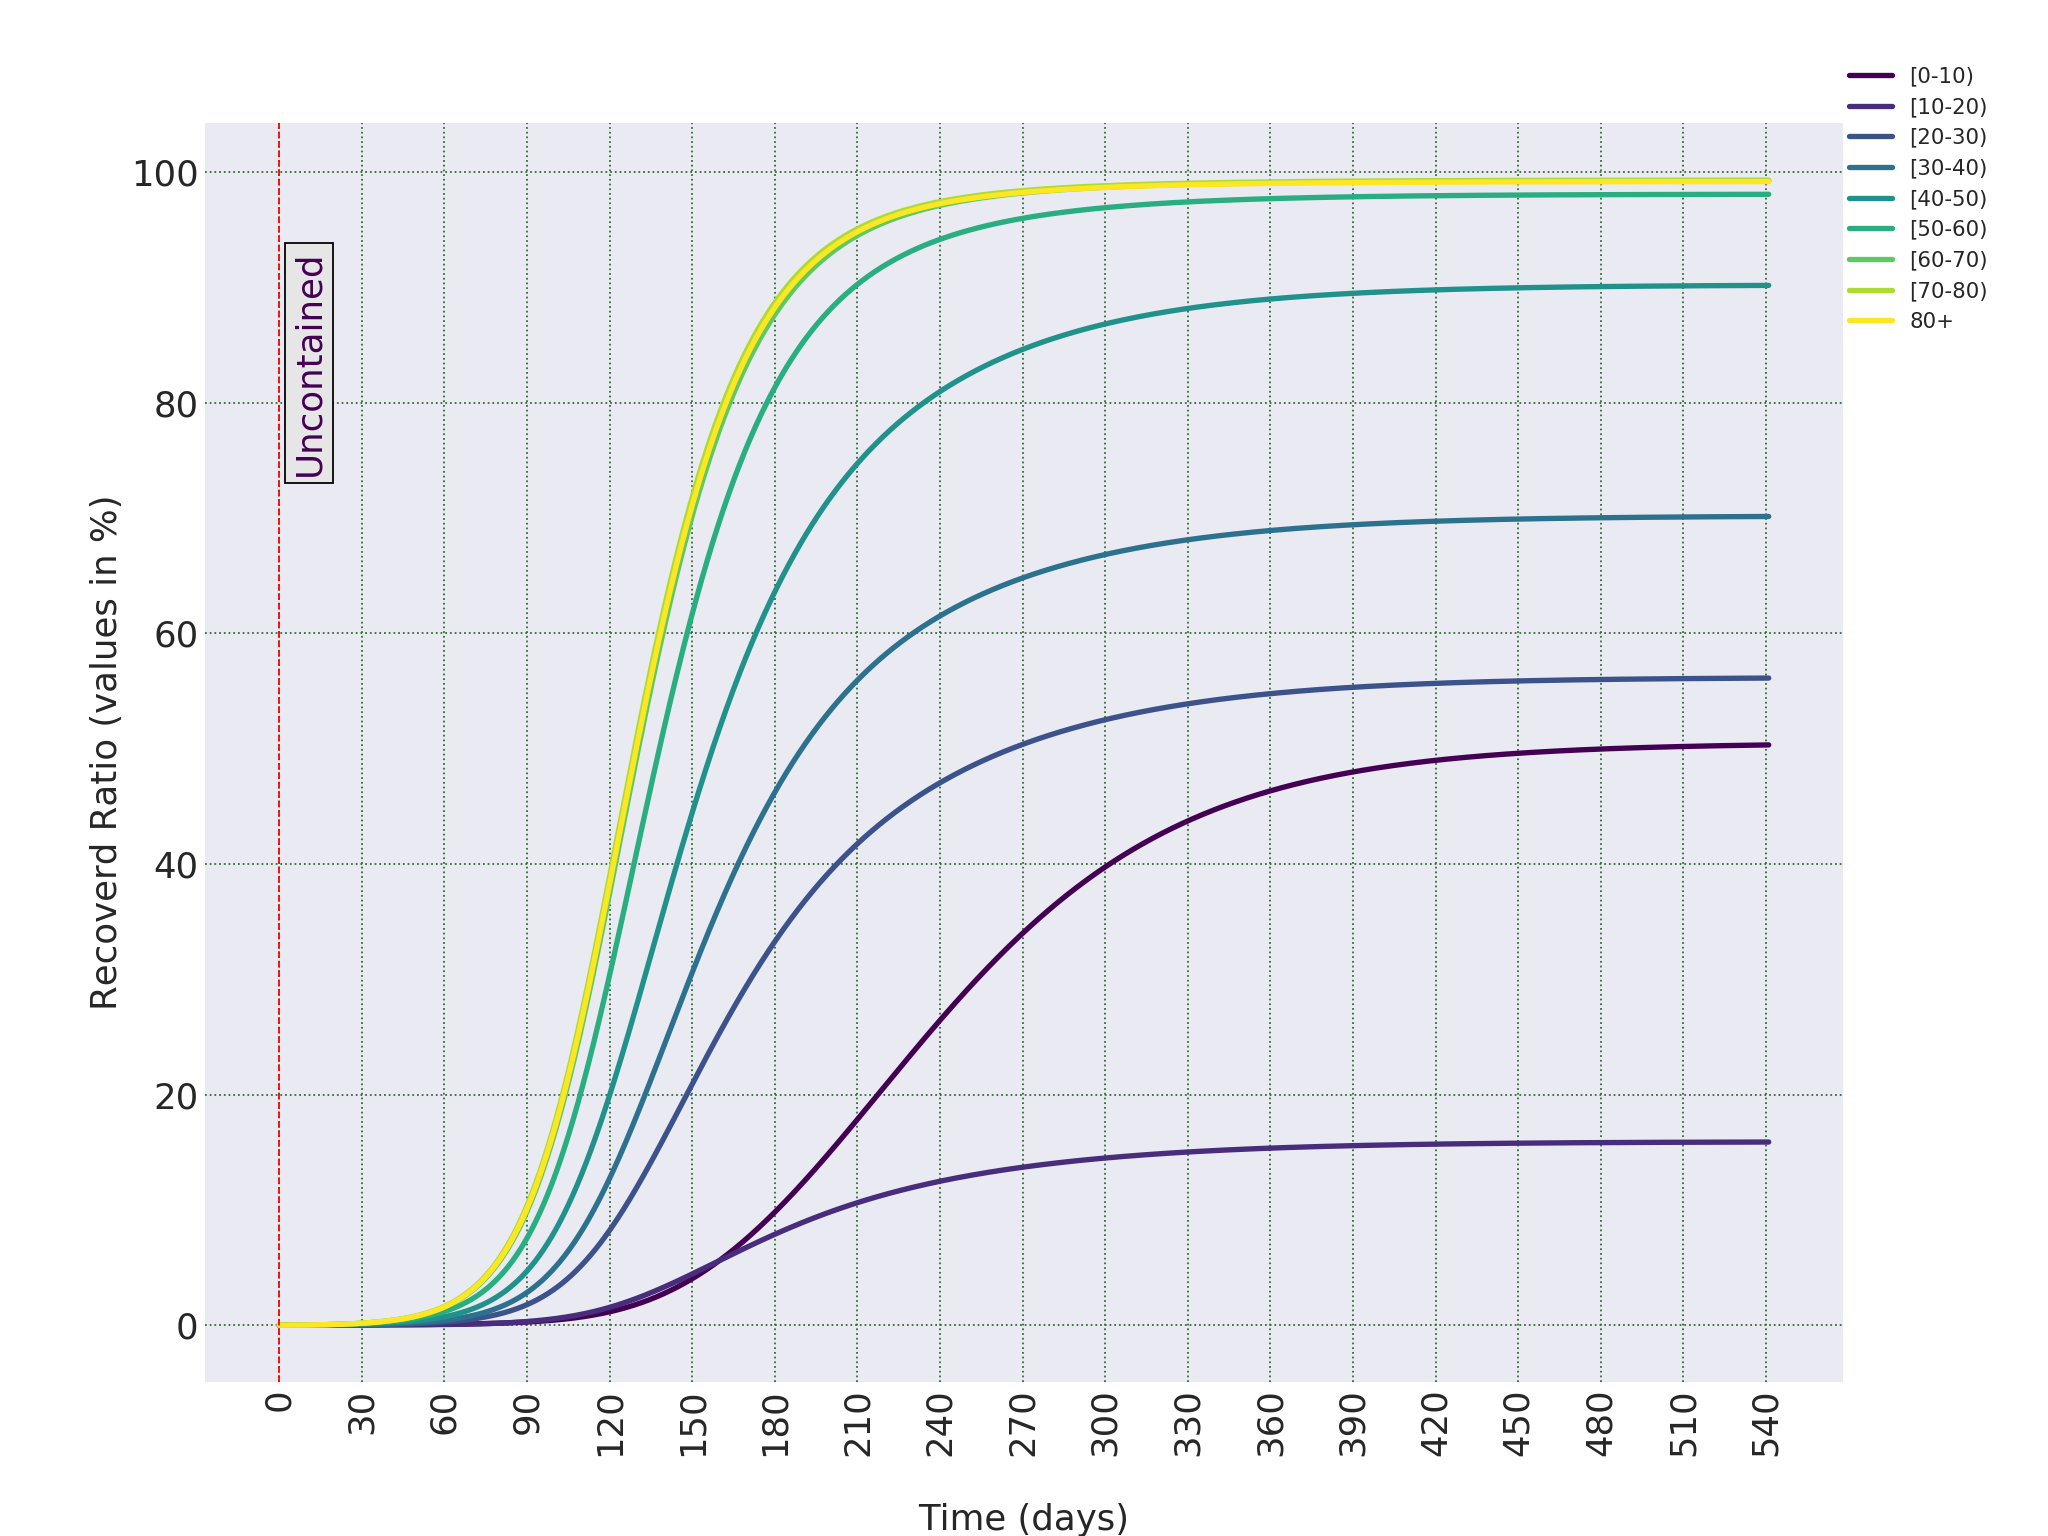
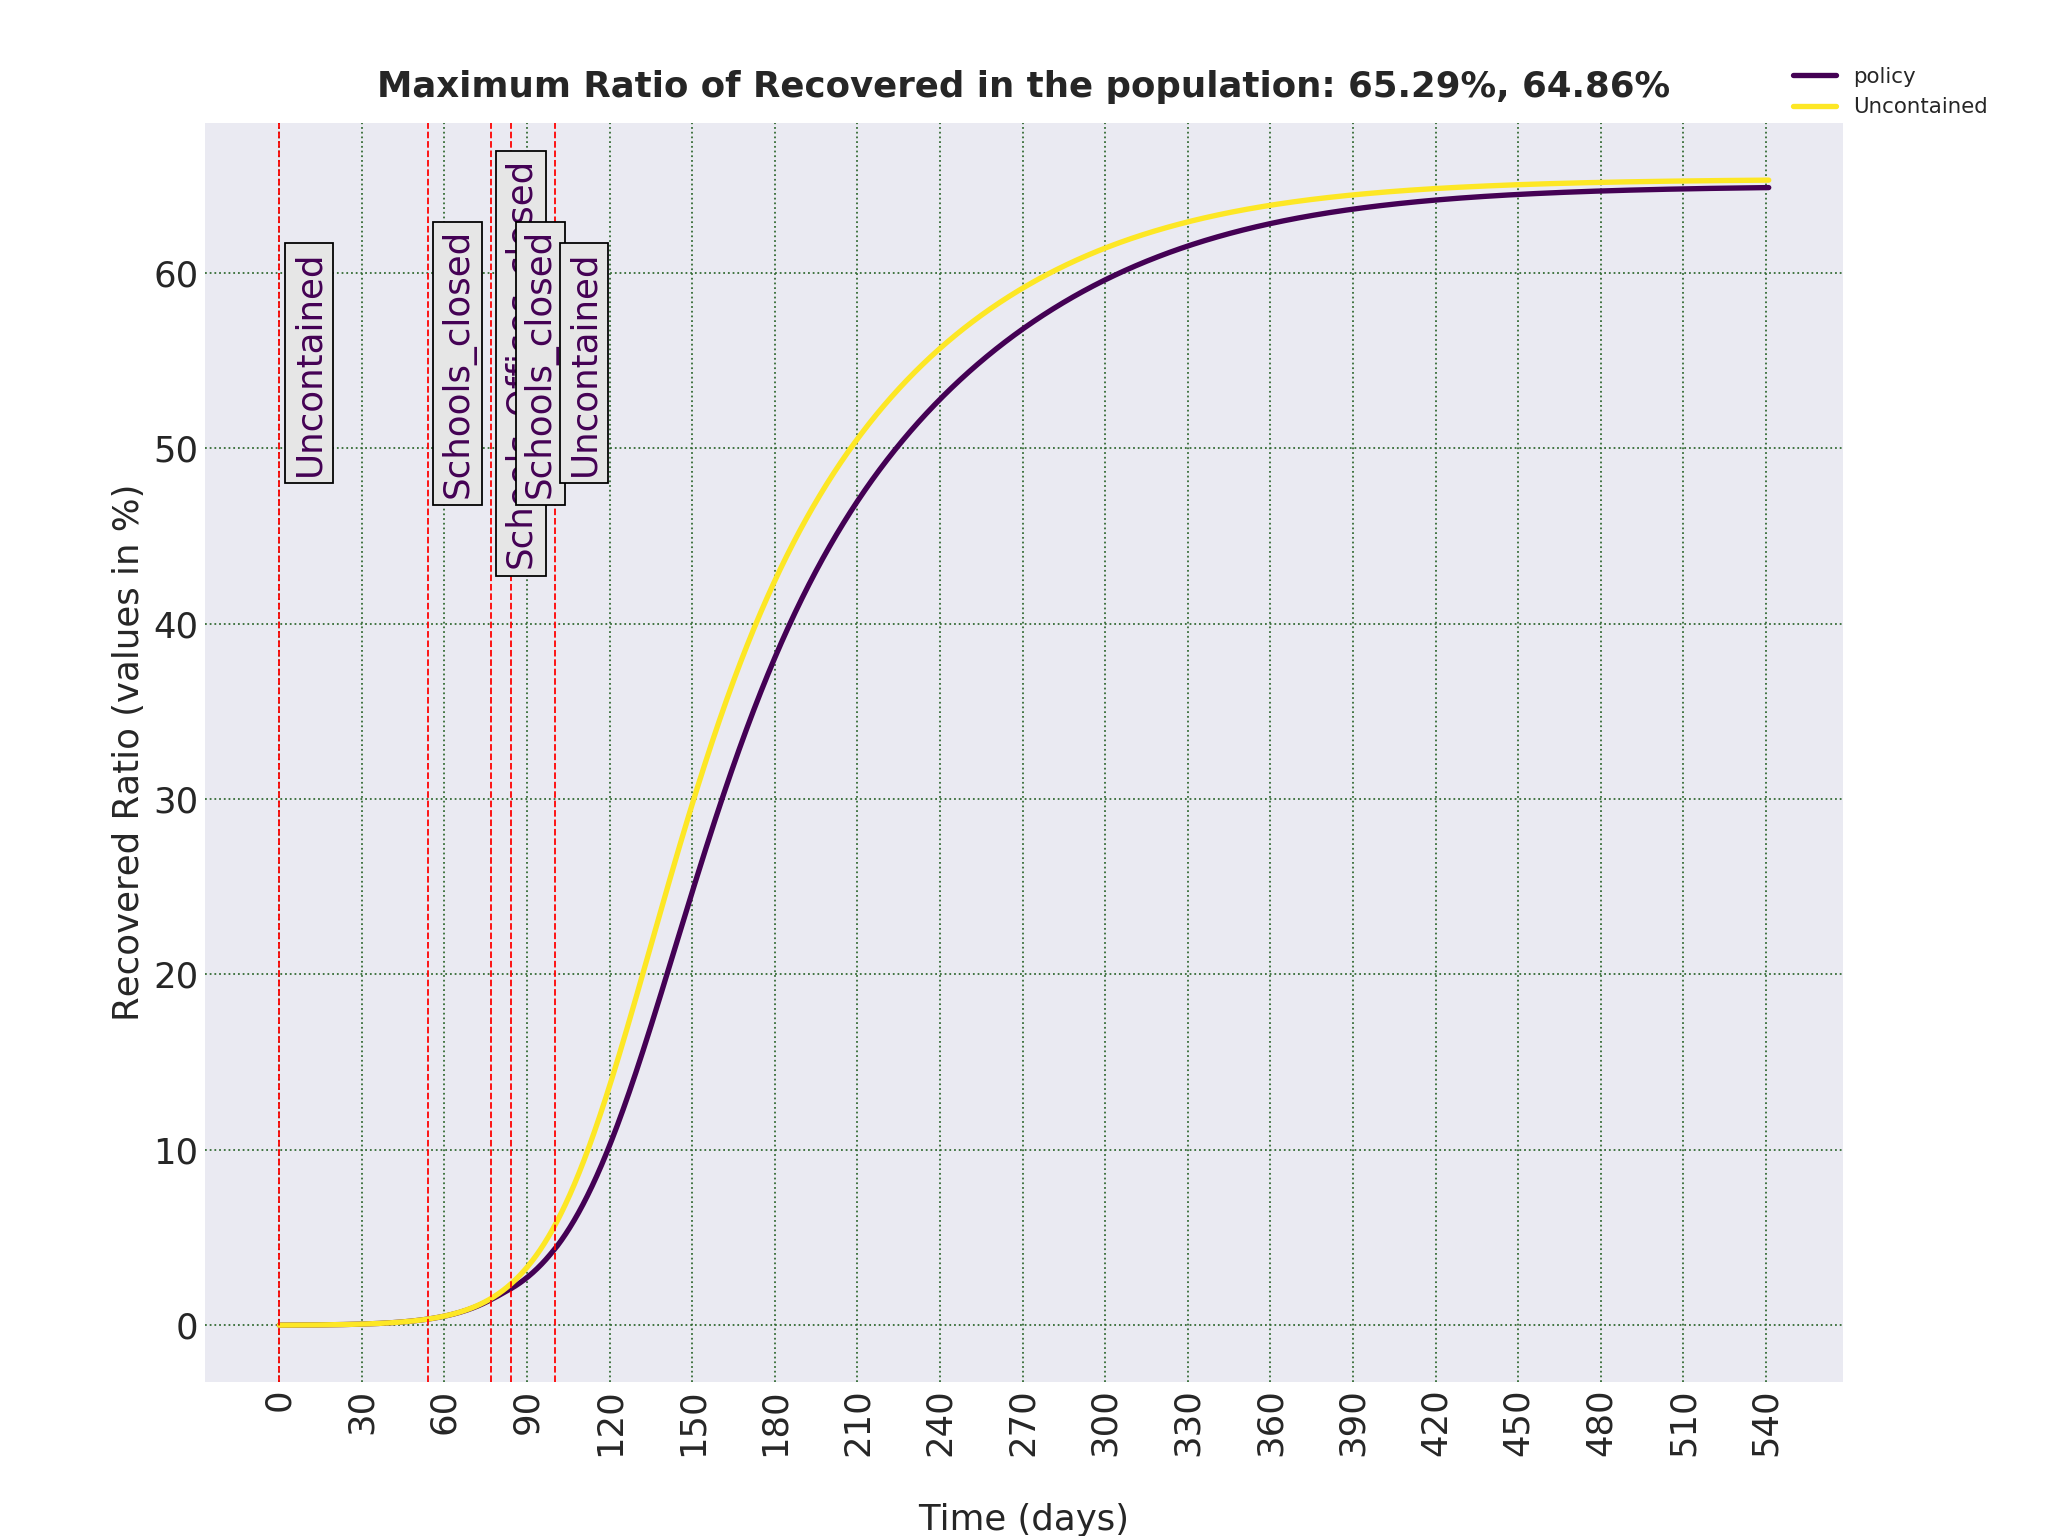
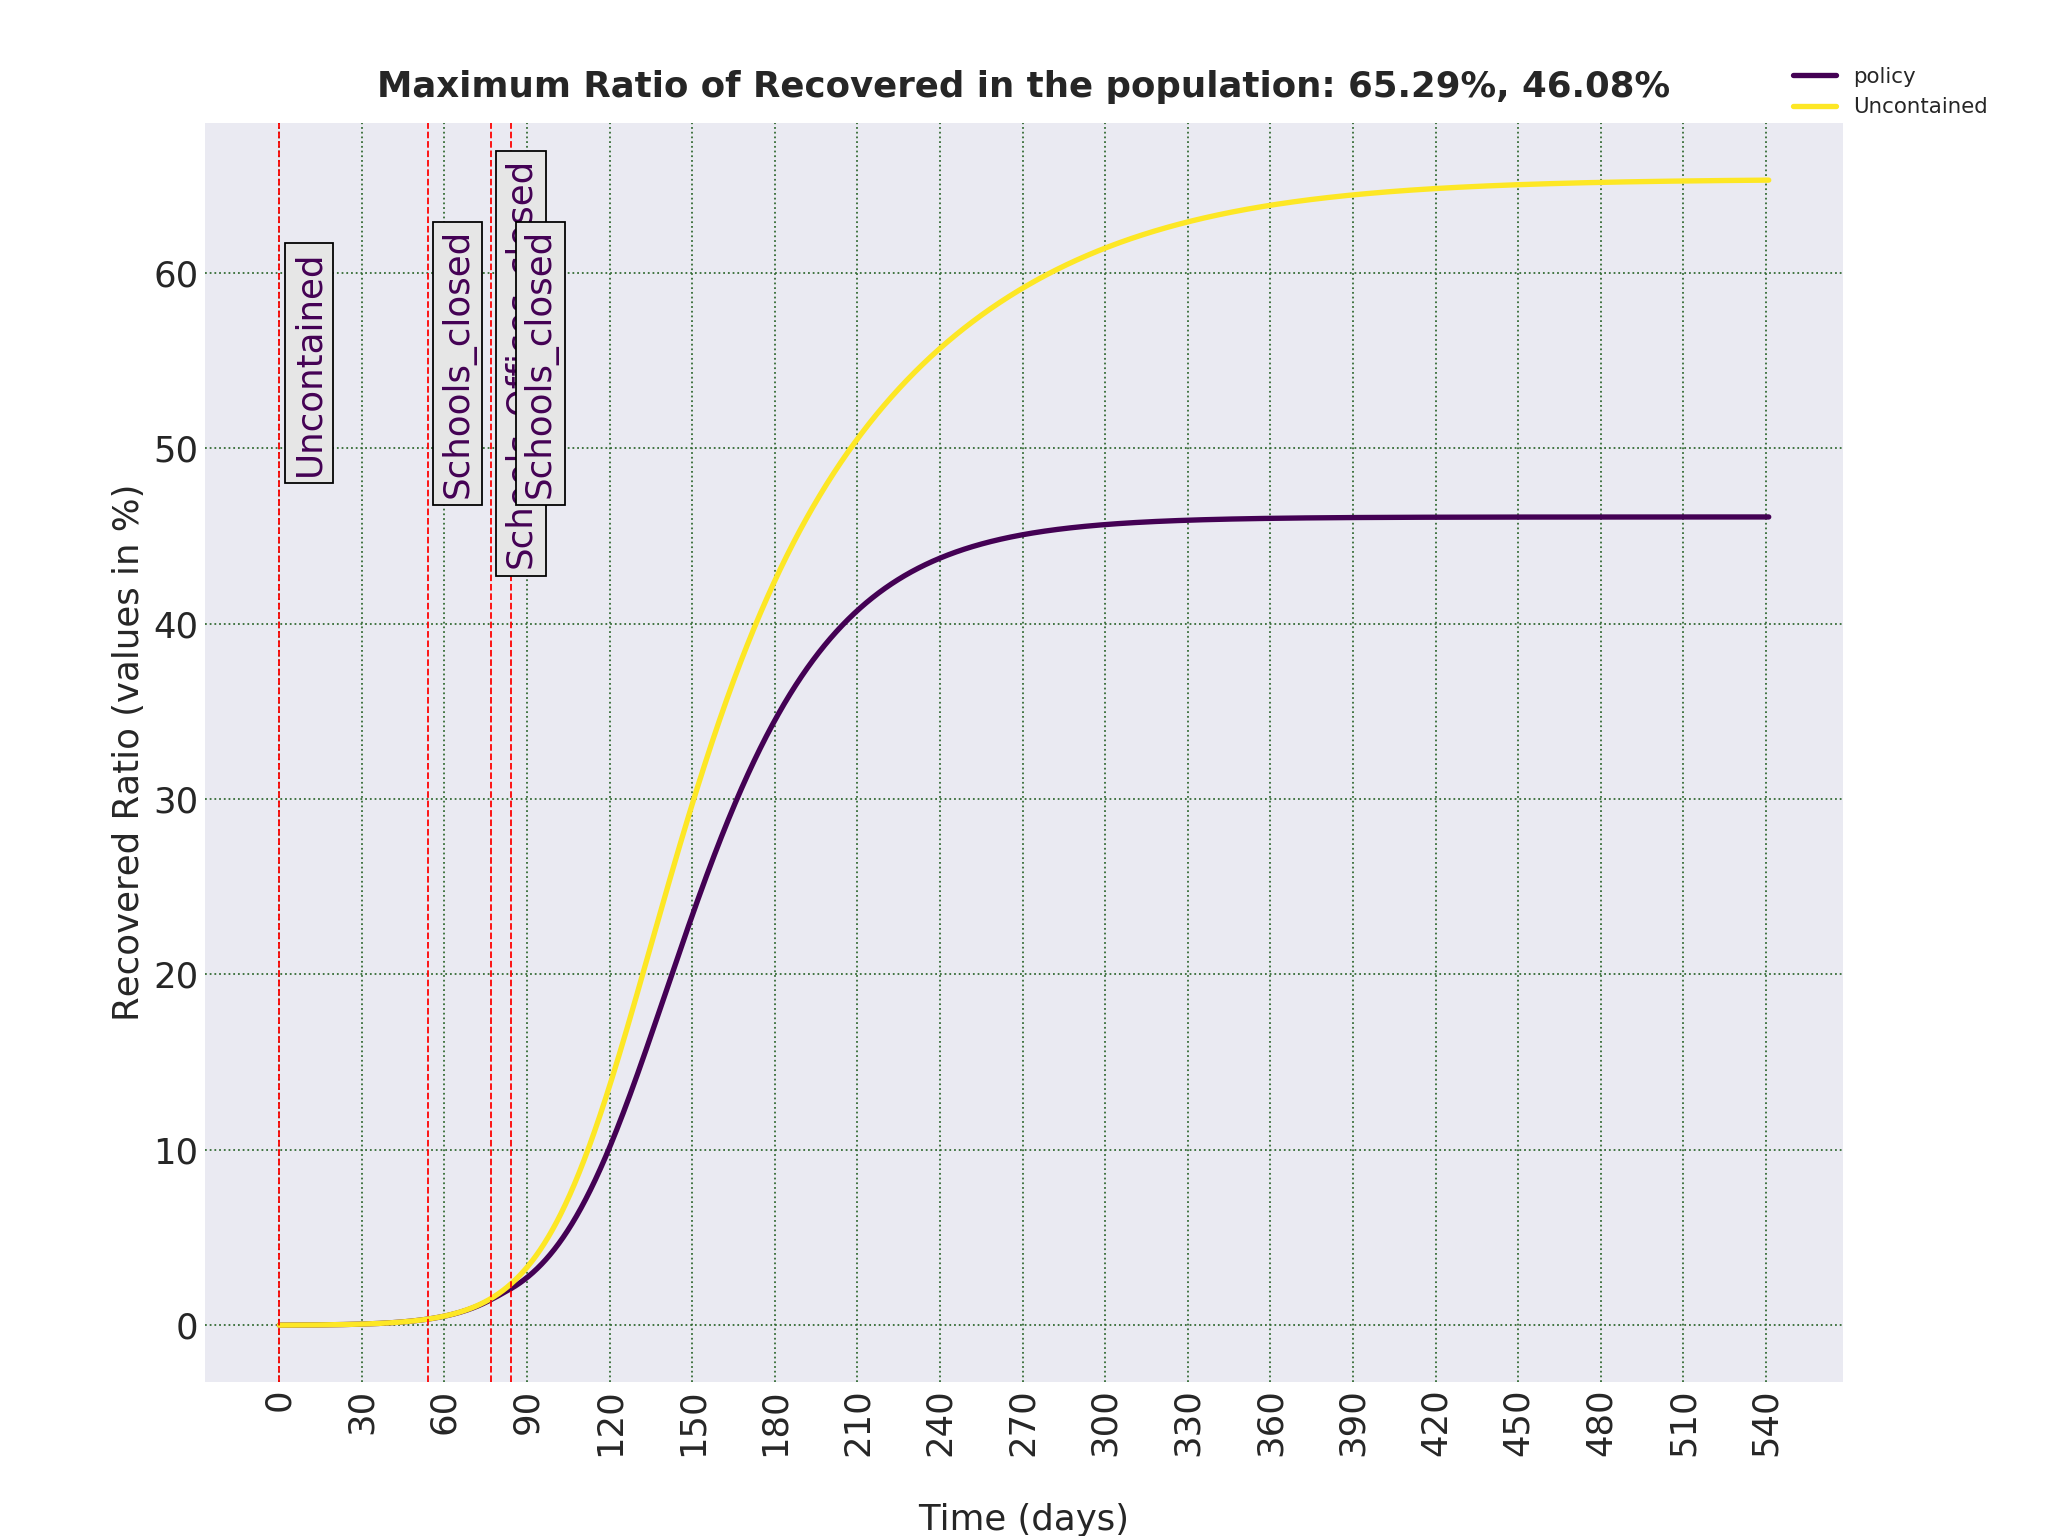
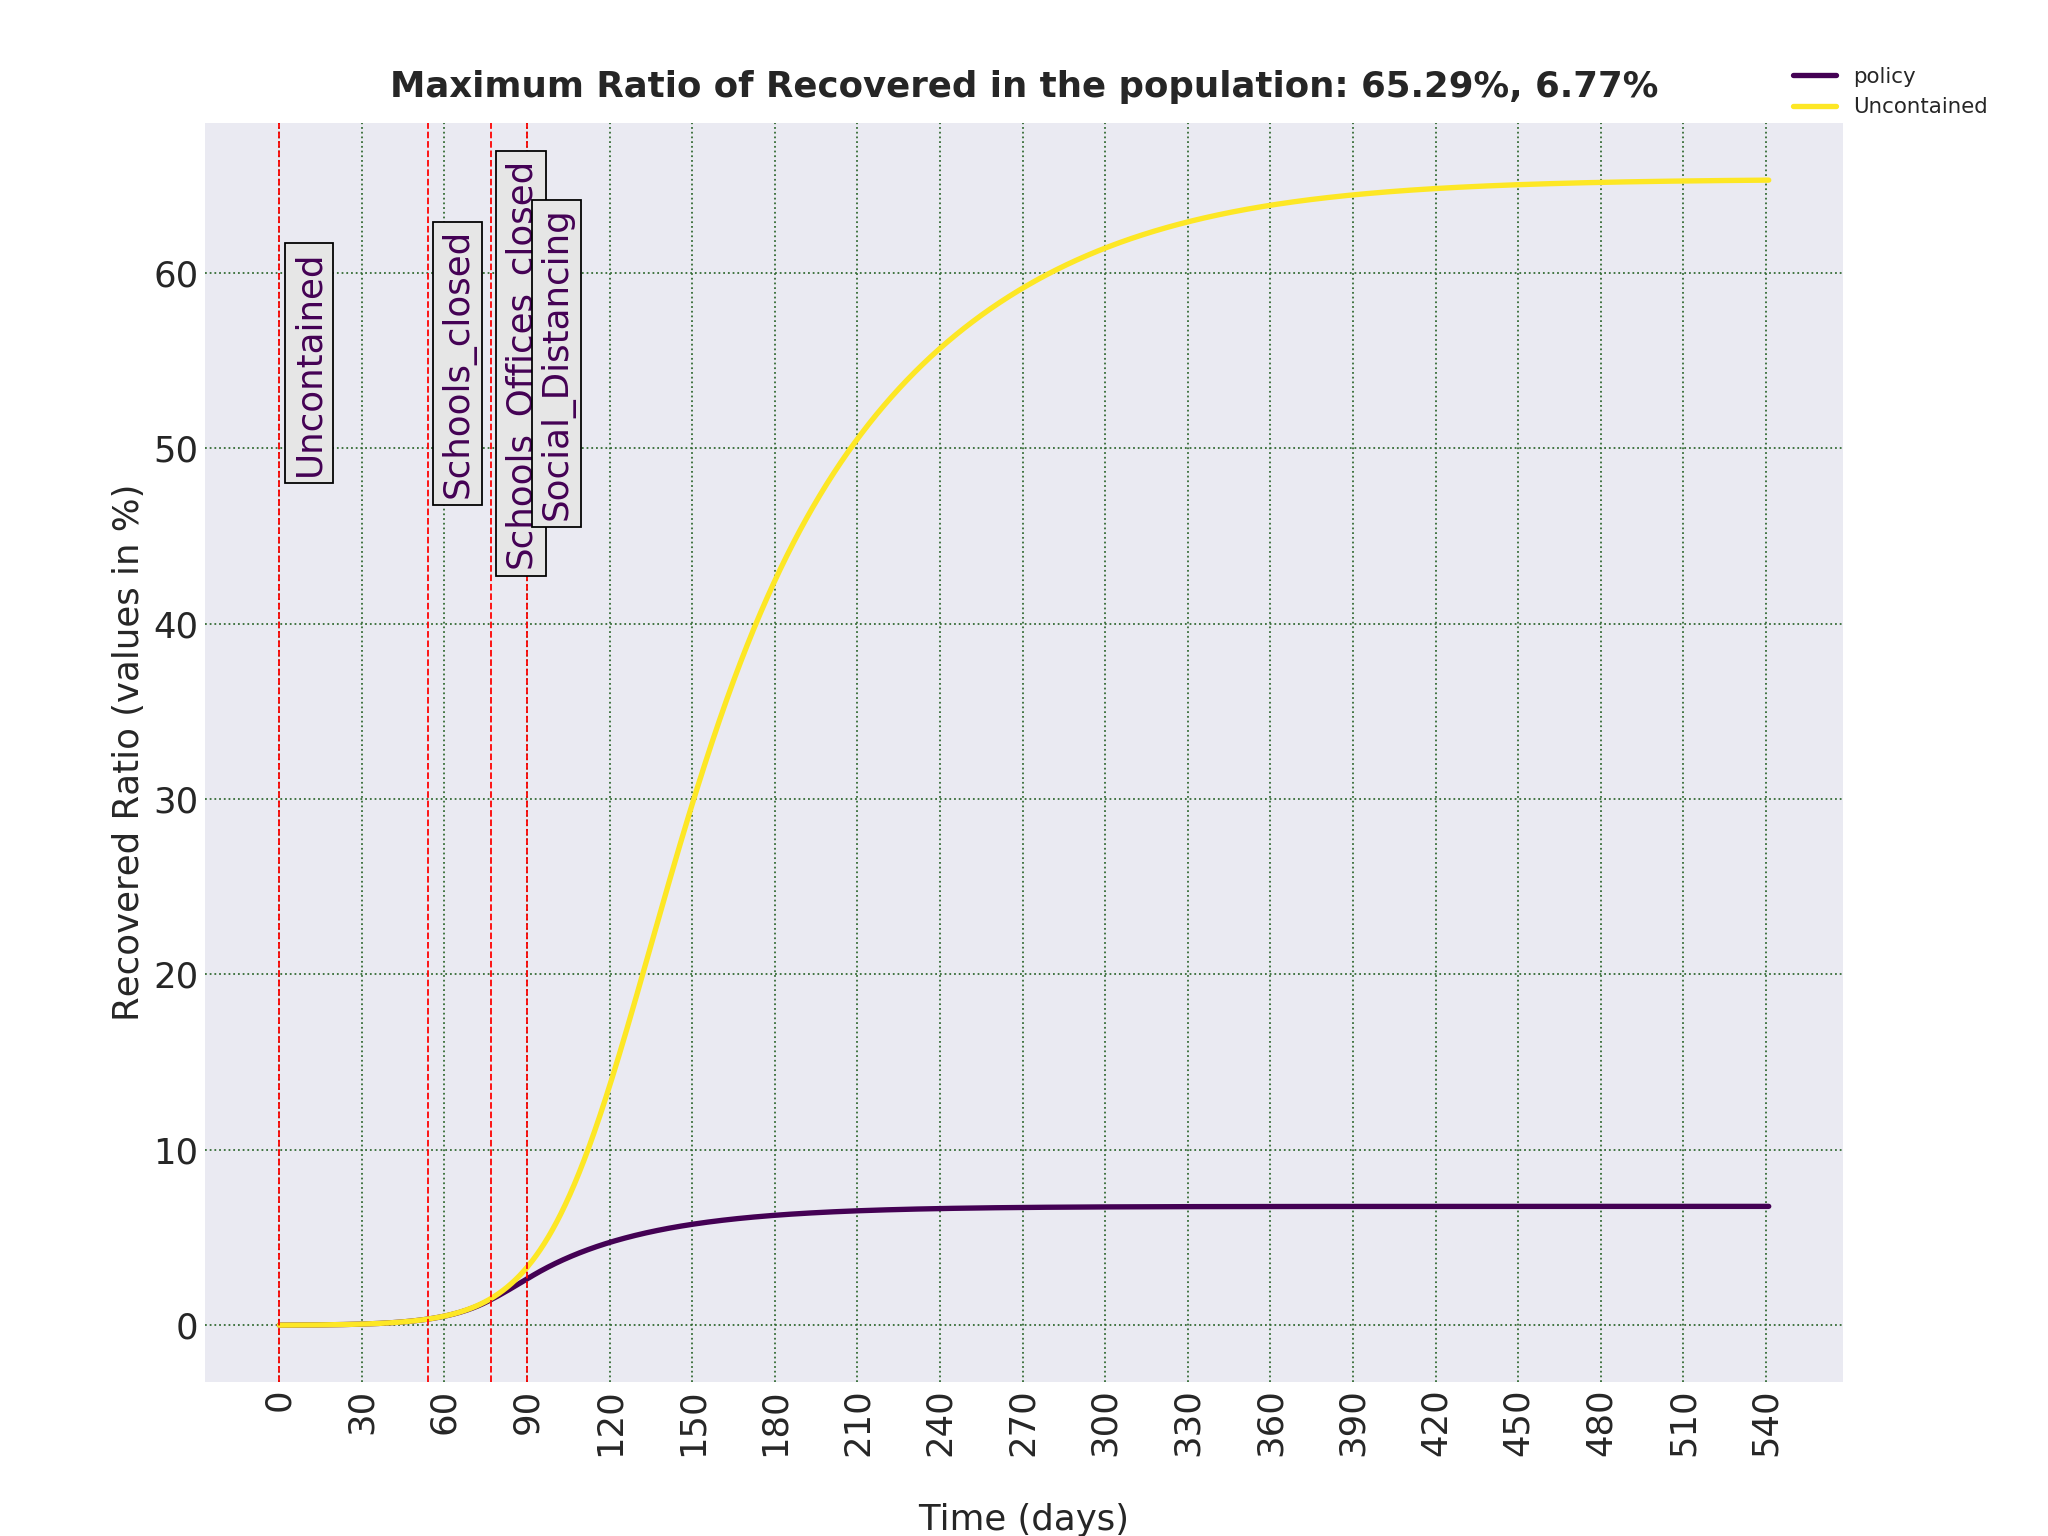
To get a picture of the total number of people who will be infected with COVID-19 in the uncontained scenario, we should have a look at the ratio of the Removed, as shown in Figures 0.3 and 0.4. Removed, also called Recovered compartment, refers to those who were infected and are not infected any more. Either because they become healthy, or because they lost their lives. I will keep using the terms Removed, because term Recovered causes confusion for some readers as they assume it includes inly those who have are cured. As we can see, in the uncontained scenario, eventually 65.17% of the population will be infected with COVID-19. For a country of around 85 million inhabitants, that is around 55 million people. It should be note that this ratio is significantly lower than countries with relatively older population. For example, in Germany, the eventual ratio of infected people in the uncontained scenario is around 80%. Germany is now in lock-down but the only official policy imposed in Iran has been to shut down the schools in late February. But as we will see, this is far from enough to slow the rate of infections.
———————————————————————————————————————————
It should be noted that the possible mortality rate in Iran or any other population is neither part of the model, nor affects the outcome of the simulations. The compartment of ’Removed’ in this model includes people who were infected and are not infected any more, either because they are cured or because they died. But in the interest of brevity, I refer to this group only as ’Removed’.
But we can still make an intelligent guess and try to come up with a rough estimate of the mortality rate. It is important to know what ratio of the 55 million people who, in the worst case scenario, might be infected with COVID-19 might die.
If we look at the current statistics on the mortality rates in different country, we get wildly different results. At the time of writing this text, it varies from 0.38% in Germany to more than 9% in Italy, 4.65% in Hubei province in China and a current global rate of 4.40%. These values are the ratio of confirmed death because of COVID-19, to total confirmed cases of COVID-19 in the population. And there are a few reasons for such a wild differences in these mortality rates. Ignoring the deliberate tampering with the statistics by certain government, there are few technical reasons for such differences. One is attributing death caused by COVID-19 to other factors. But given the awareness of COVID-19 all around the world, we can ignore those cases. But more importantly, if the total number of confirmed cases are less than the actual Infectious people, which is always the case, then reported ratio is an overestimation. On top of that, if the number of patients that need respiratory and intensive cares exceed the capacity of the healthcare system of a country, which seems to be what is happening in parts of Italy, then the mortality rate starts to soar.
If we consider the statistics in Hubei province as a benchmark (and hope that Chinese authorities have not tampered with the data too much), and if we assume only 1 in 10 of positive cases have become noticeable and consequently tested for the COVID-19, then the actual death rate should be close to 0.46%. But the population pyramids in China and Iran are completely different. For example, 52.6% of the Chinese population are under 40, while that ratio in Iran is 66.8%. So, if as a rough estimate, we assume mortality rate in Iran is even less than half of Hubei Province in China, we can use the value of 0.2% as a rough, and quite possibly optimistic, estimate for mortality rate in Iran. But we should keep in mind that this figure is obtained under the assumption the health-care system is not overloaded (or at least not more than what it was in Wuhan city) and the care and assistance required for patients with more severe symptoms are provided. But as the number of patients in Iran increase, mortality rate would increase as well, which is a likely scenario if nothing is done to contain the spread of COVID-19.
But even with the estimate of 0.2% death toll for Iran in the uncontained scenario would be around 110, 000. A catastrophic outcome for the Iranian society.
To run the simulations that has led to figures such as the ones presented above, I needed to assume an initial condition for the number of Infectious in the population. Also, to figure out where in this curve are we now, we should know when is day 1, the day that the virus was introduced into the populations. It should be noted that the model accepts external Infectious as inputs in various times during the spread of the virus. But I have ignored that possibility and assumed a fixed number of initial Infectious in the population. The justification for that decision is that when the virus starts to spread and number of Infectious increase, very soon the existing population of Infectious is of orders of magnitude higher than incoming infected individuals. So, adding these external inputs does not really affect the simulation outcomes. And apart from that, when the numbers of Infectious are so low, the model, which is based on continuous ordinary differential equations, becomes unreliable.
To estimate the population of the initial group at the beginning of the spread of COVID-19 in Iran, given the lack of any reliable information, I had to rely on circumstantial evidence. For example, a former health minister has said that he has warned the authorities about the spread of COVID-19 in late December. Given the fact that the Chinese authorities were still in denial at that stage (as late as January 14th, the official line was that there is no strong evidence for human to human spread of COVID-19) and assuming the claims of this former minster are true, then the number of people infected with COVID-19 and the number of those who needed intensive care should have been high enough to make it distinct from the number of the cases of seasonal flu. Based on that and other reports of citizens in social networks, I have assumed that at the end of December, 1 in 100,000 of the population have been infected with COVID-19, which for a country of 85 million population, is 8500 people.
Please note that variations in this initial population does not change the eventual infected ratio of 65%. It changes the number of days it takes to reach there, and more importantly, the day in which we reach peak value of Infectious. With the above mentioned estimate, that day as can be seen in Figure 0.1 is 135 days from early January, which is mid-May. If the initial population is of an order of magnitude lower than our estimate, we reach the peak at day 171, and if it is of an order of magnitude higher than our estimate, then it will arrive in day 98, which is two days from now. But given other evidence, I have chose 1 in 100,000 in early January as the initial conditions for the simulations.
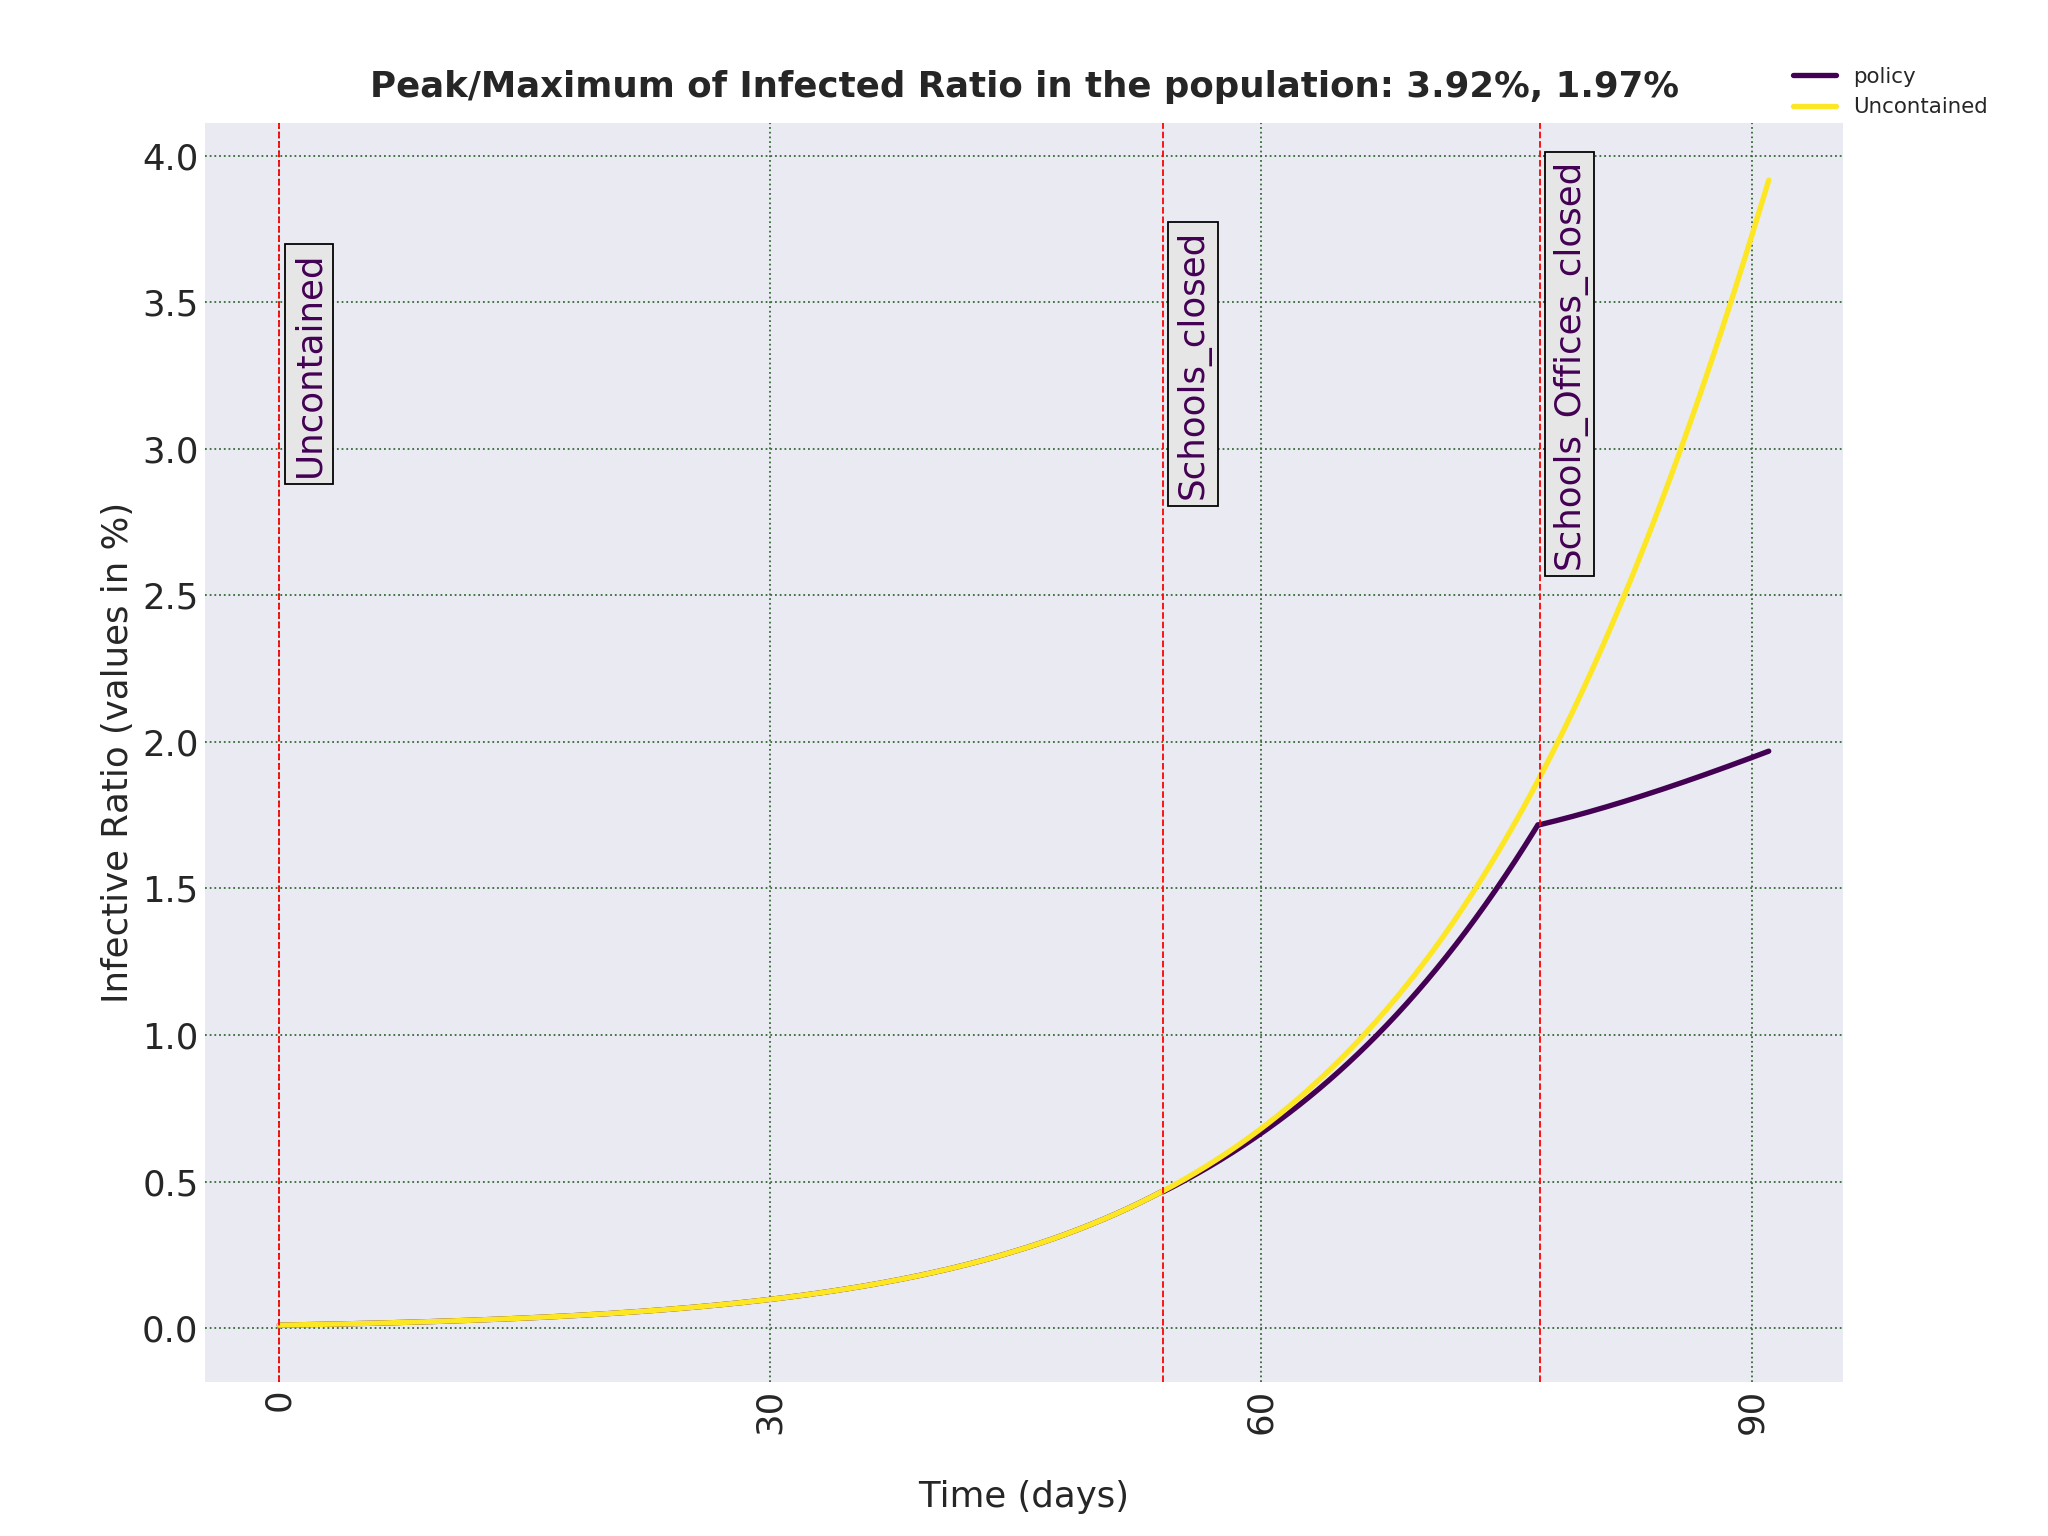
For all practical purposes, spread of COVID-19 has been uncontained in Iran. The only official containment policy has been to shut down schools and universities one months ago. Banks, governmental offices has been open, with the exception of the last week of Persian year (3rd week of march), which they have worked in half capacity, and the first few days of the Persian year which they have been closed. But they are all open now. Schools, as it is customary in Iran, will stay closed for the first two weeks of Persian new year (end of 1st week of April). At the moment, there is no official statement on whether ot not they will be reopened then.
I have assumed shutting down schools and universities means 90% decrease in contacts of the population under the age of 20 and that half-closing banks and governmental offices and partial self-imposed social-distancing by adults aged 20-70 means 50% decrease in the number of their interactions. And I have assumed no major changes in the lifestyle of those older than 70. With all that in mind, the model tells us that the current situation in Iran is as shown in Figures 0.1 and 0.2.
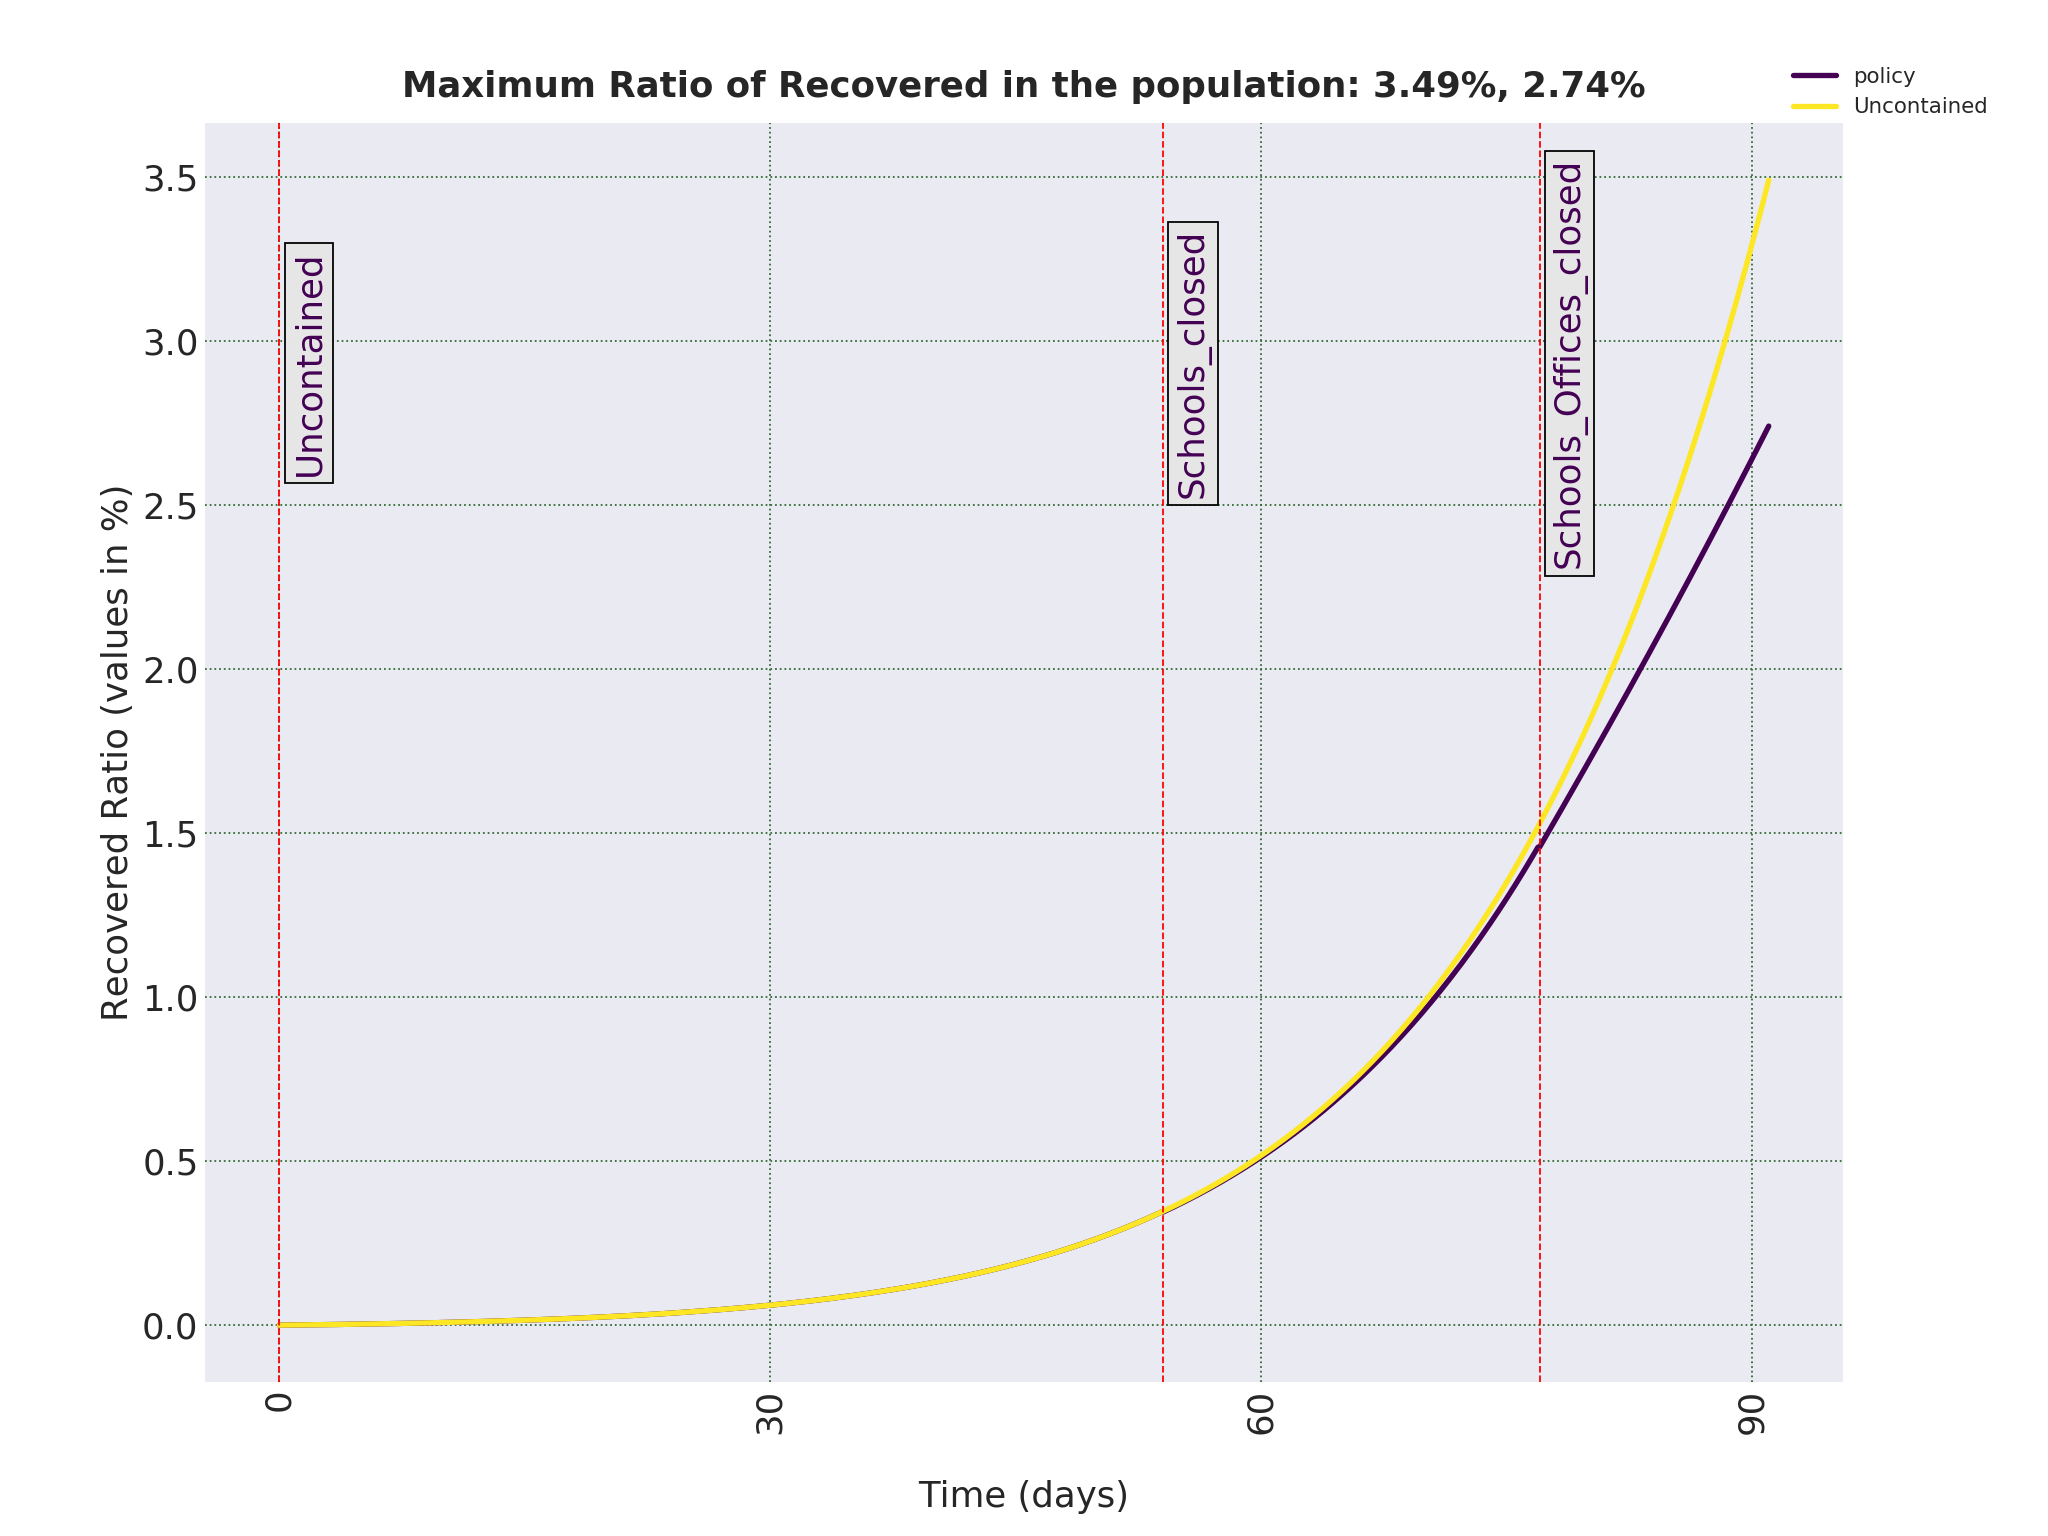
The effect of closing banks and offices can be seen in the abrupt change in the number of Infectious. Total number of Removed is also decreased to 2.74% from the 3.49% that it could be in uncontained scenario. To see how things can develop from now on, we need to simulate various scenarios, as shown in the following sections.
———————————————————————————————————————————
Given what the models tells us about the current status, the natural questions that arises is the effect of different containment strategies on the peak number of Infectious and also total number of Infectious in the Iranian population. Let’s start with the worst possible policy to adopt, uncontained scenario.
Let’s first assume the Iranian authorities decide to open the schools and universities in the third week of the Persian year. Figures 0.1 and 0.2 show what can happen. Under such a scenario. the effect of closing down schools for 1.5 month and offices for a couple of weeks would be negligible in the long run. The peak percentage of instantaneous Infectious drops by around 0.7% and time to that peak changes by a few days from 135 days to 144 days. In other words, no major differences in the dynamics of the spread of the virus.
———————————————————————————————————————————
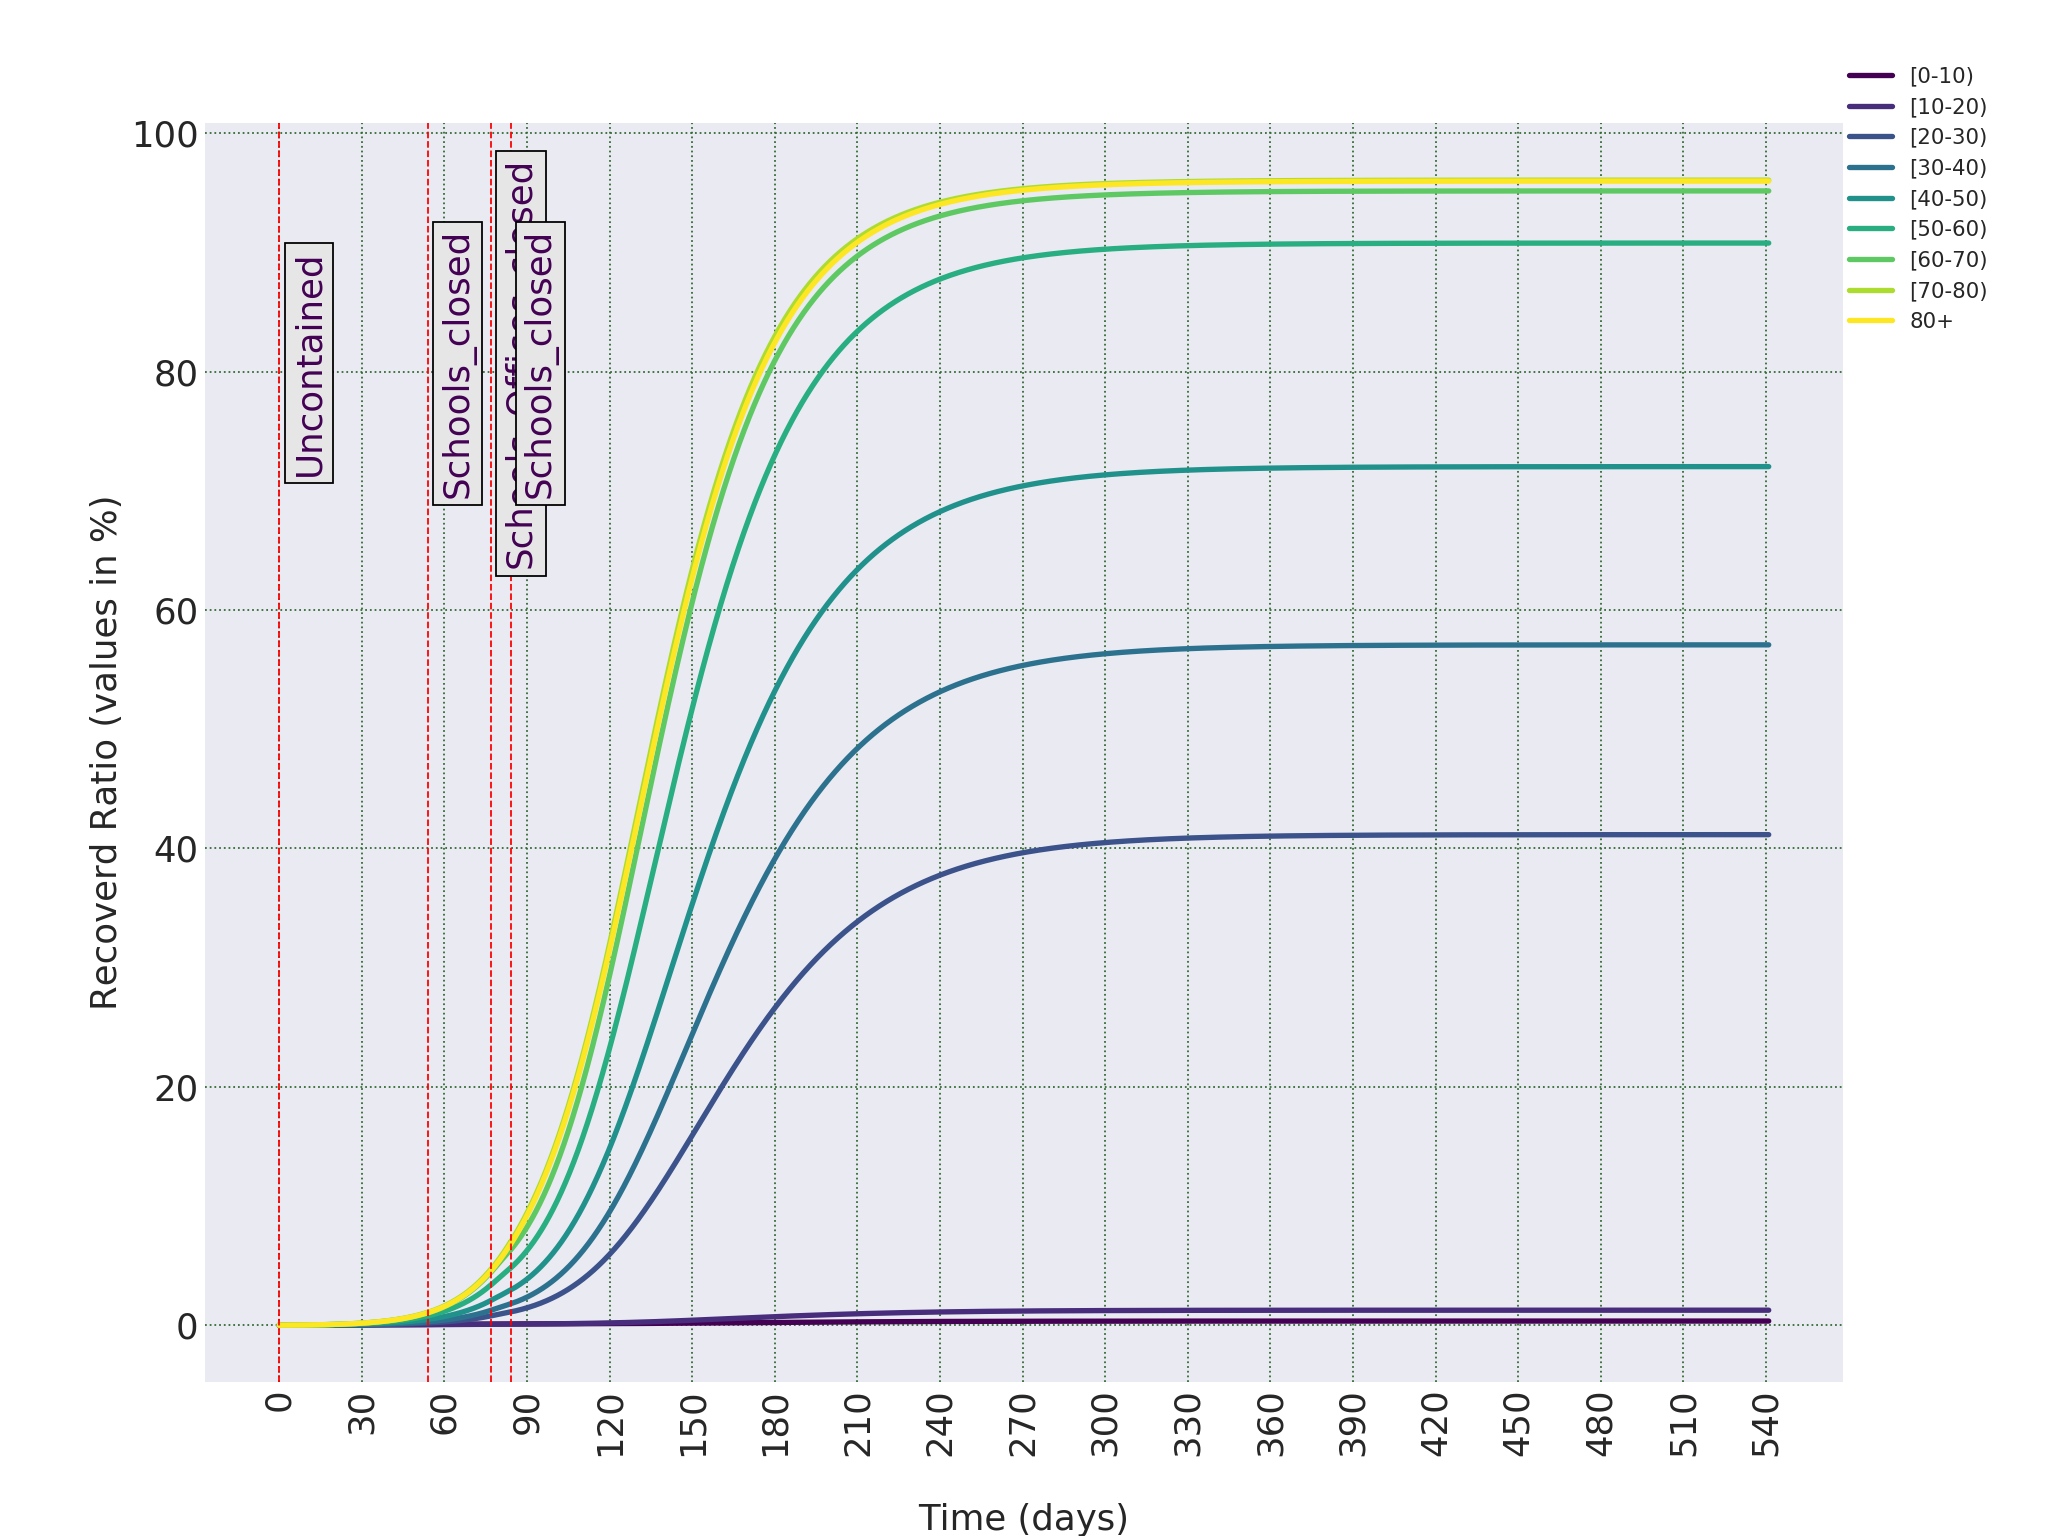
The current decision is to open the governmental offices with no official restrictions on gatherings, and private sector. Let’s assume Iranian authorities decide to keep the offices open and schools closed. The following two figures show what happens if schools remain closed for a long time. The peak of Infectious drops from around 11% to 9.2%, and eventual number of Removed drops to 46% of the population. That means that keeping the schools closed in the foreseeable future without imposing any other policy would spare around 19% of the population, equivalent to around 16 million people, from the COVID-19 infection. Which seems good, but looking at the trajectory of the Removed cases (those who were infected and nor infected any more) for each age group, as shown in Figure 0.3, we can see that this decrease is mostly because of the decrease in the number of cases in age groups 0-10 and 10-20, whose mortality rates are very close to 0. In other words, this policy will spare many children and teenagers from the infection, but have minimal effect on the number of deaths because of COVID-19.
———————————————————————————————————————————
———————————————————————————————————————————
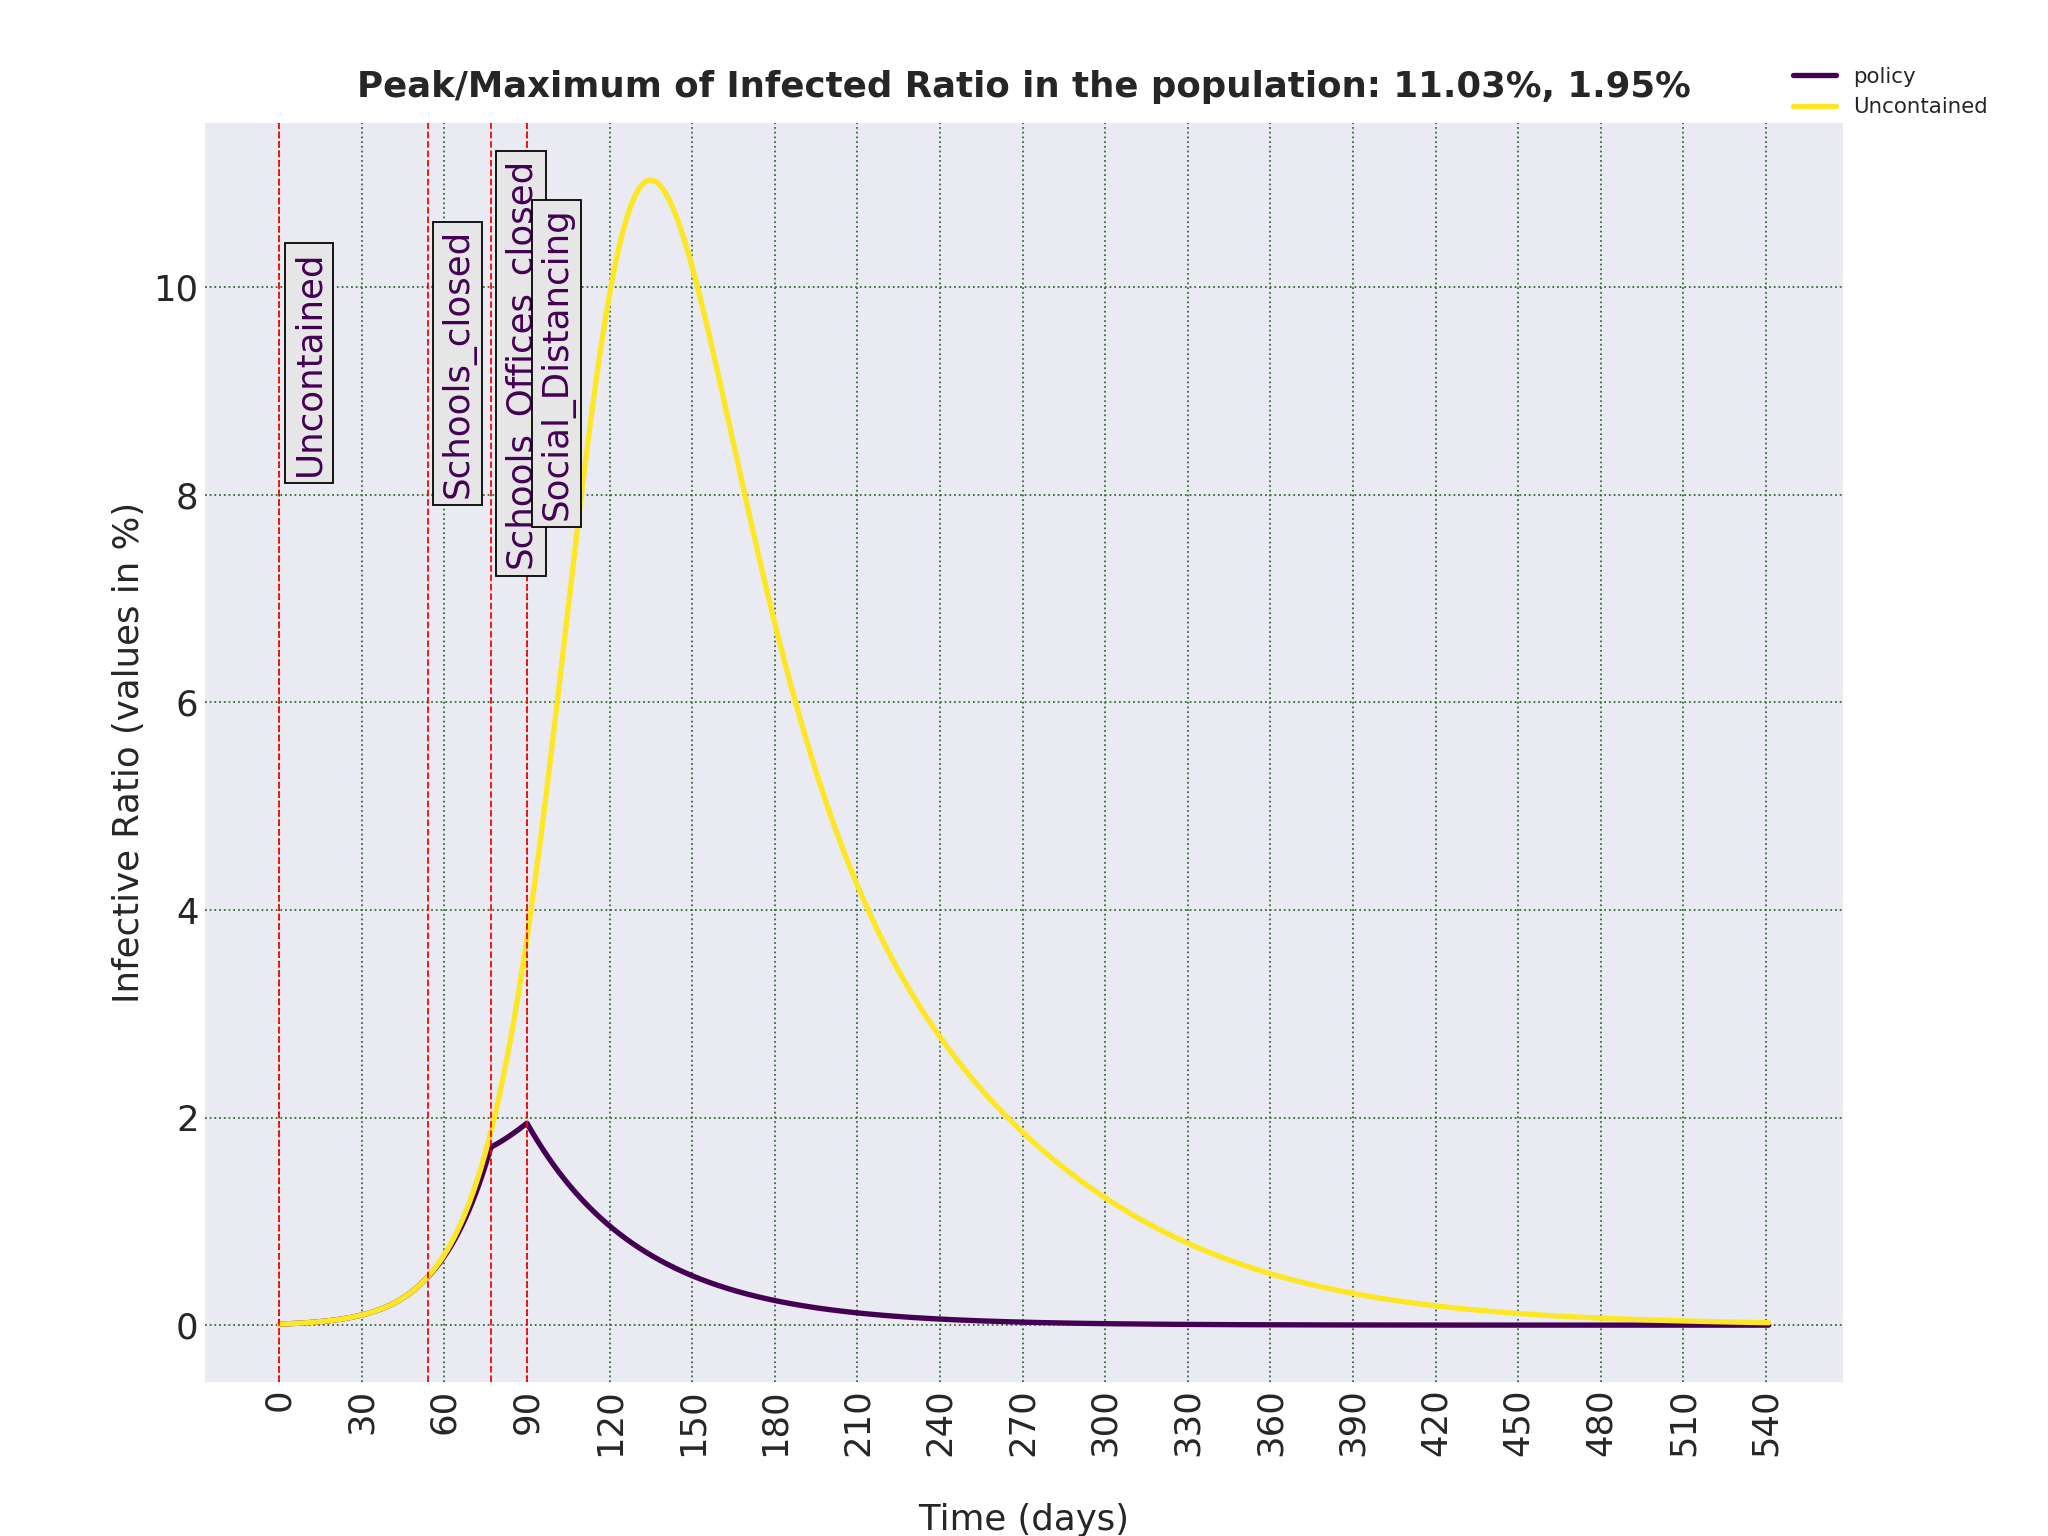
Now let’s assume the Iranian authorities do not decide to impose an official lock-down, but Iranian people decide to apply social distancing in their everyday lives. I have assumed such a scenario means the number of interactions among age groups until 70 years old decreases to 20%, and for people above 70 to 50% of their normal life-styles. The following figures show the effects of such a policy.
Good news is that such a policy will make the reproduction number, R0, less than 1 (actual value is R0 = 0.68. That means each individual in the course of the disease on average will infect less than one person, and the disease starts to die out. Under such a policy, total number of Removed falls from around 65% to just 6.77%, a significant decrease. Which means thousands of lives would be saved. The bad news is that the time that such a policy will bring the number of Infectious to a negligible ratio is of the order of months. In other words, although such a policy is very effective, but it is not something that can eradicate the disease in a matter of weeks. This can be seen if we look closely at Figure 0.1.
———————————————————————————————————————————
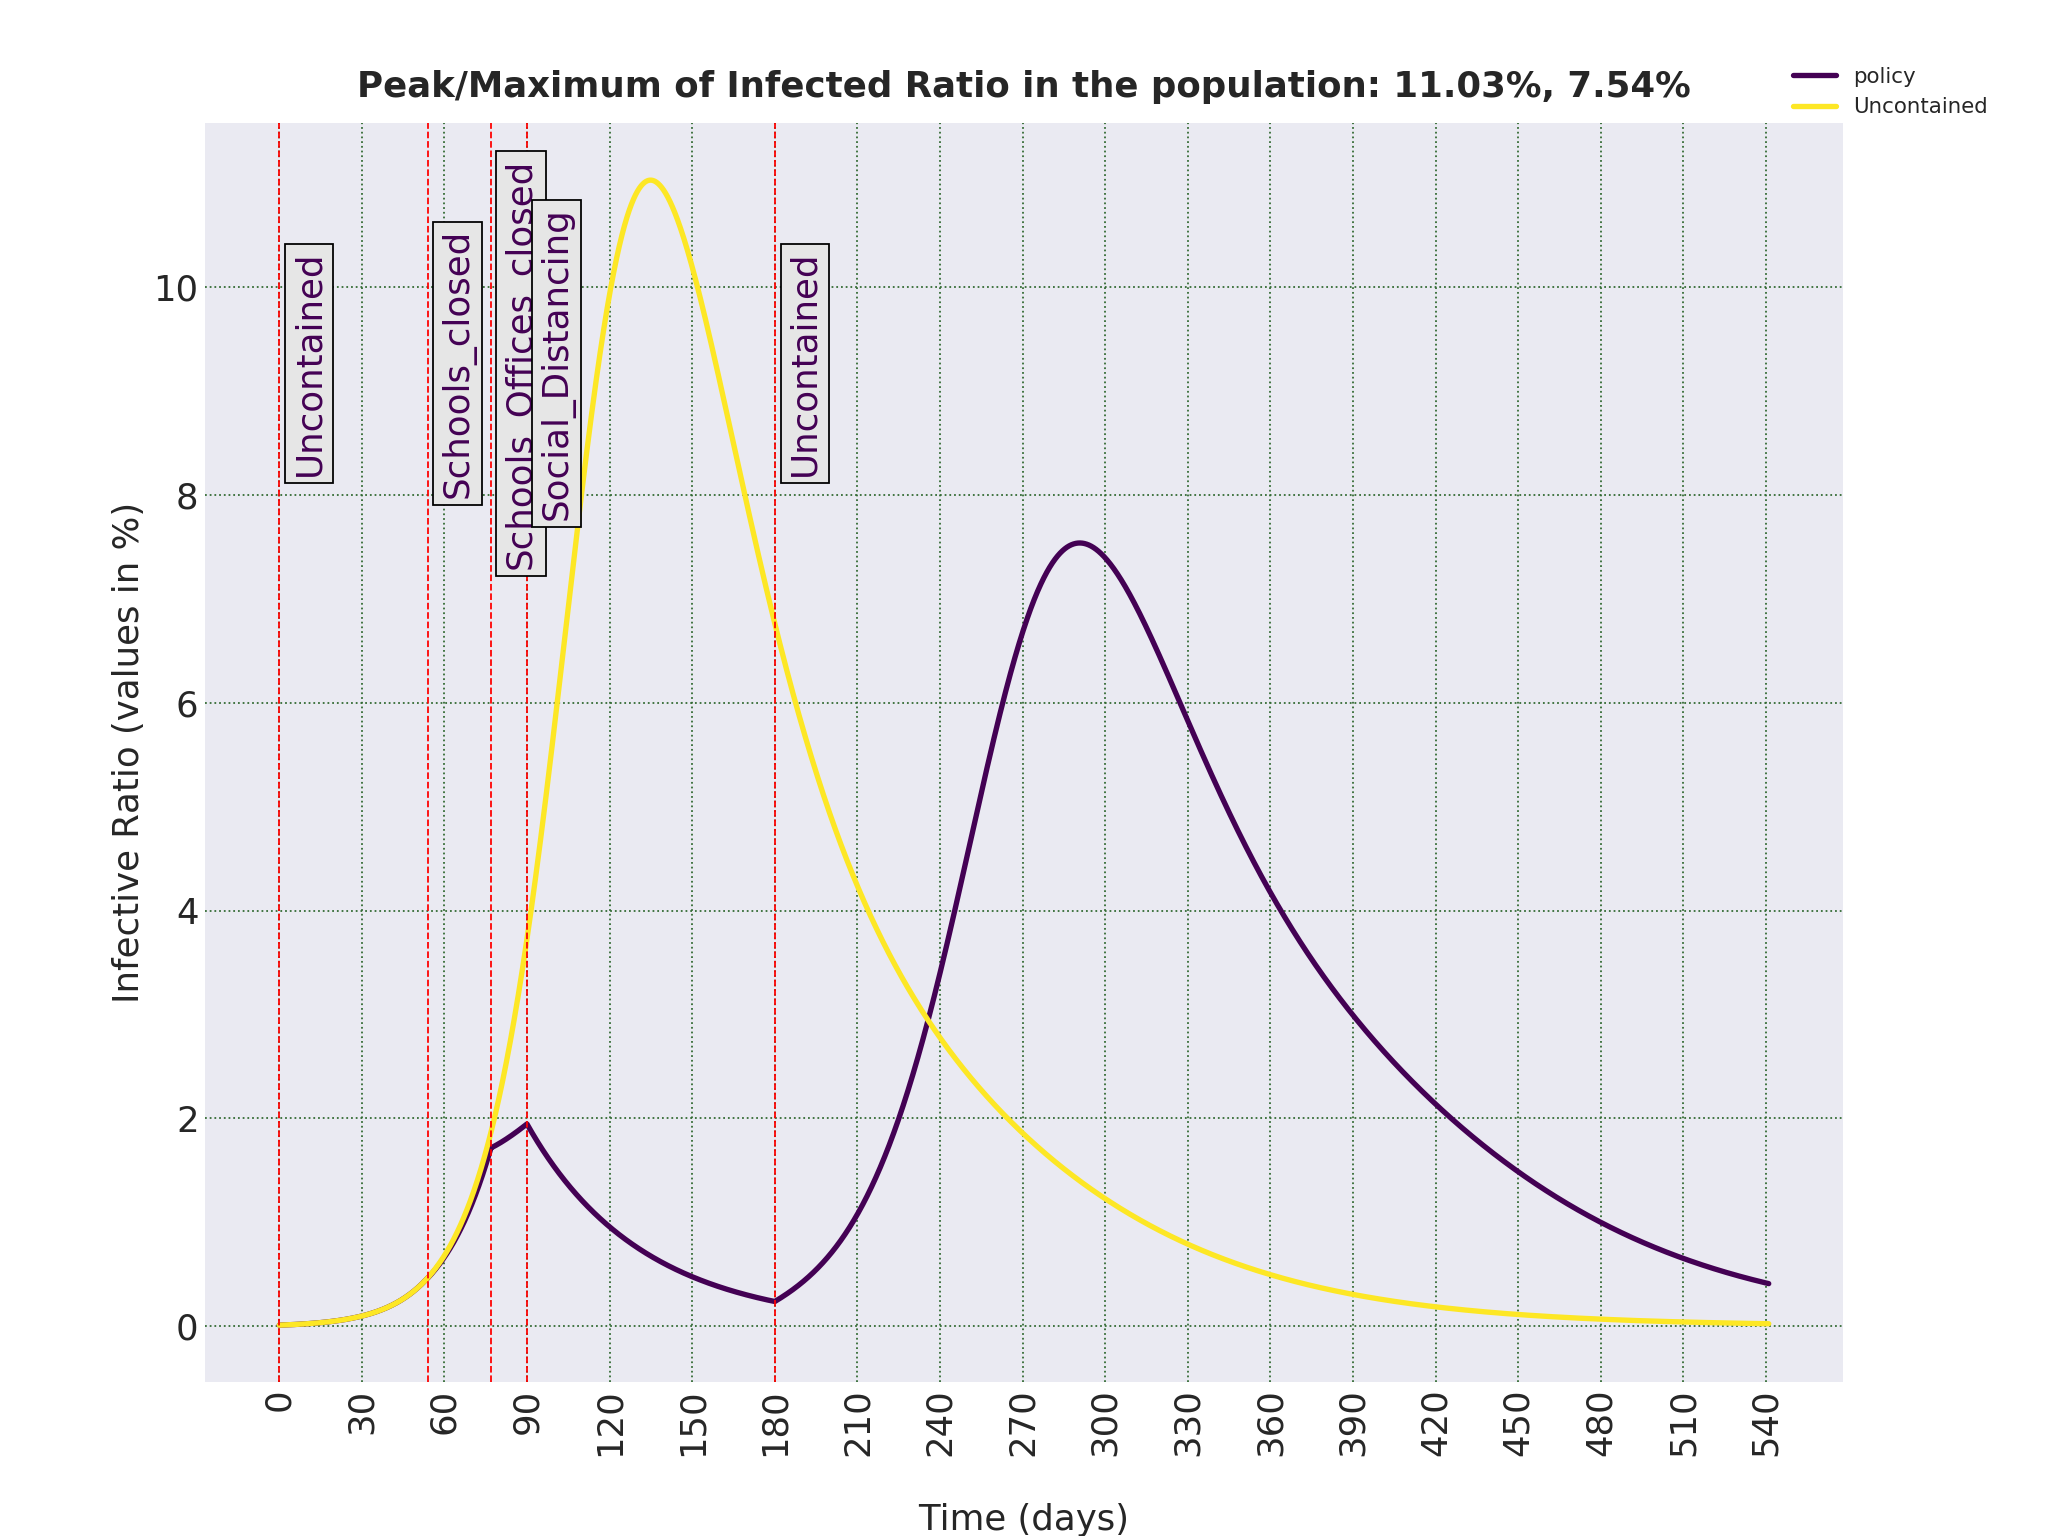
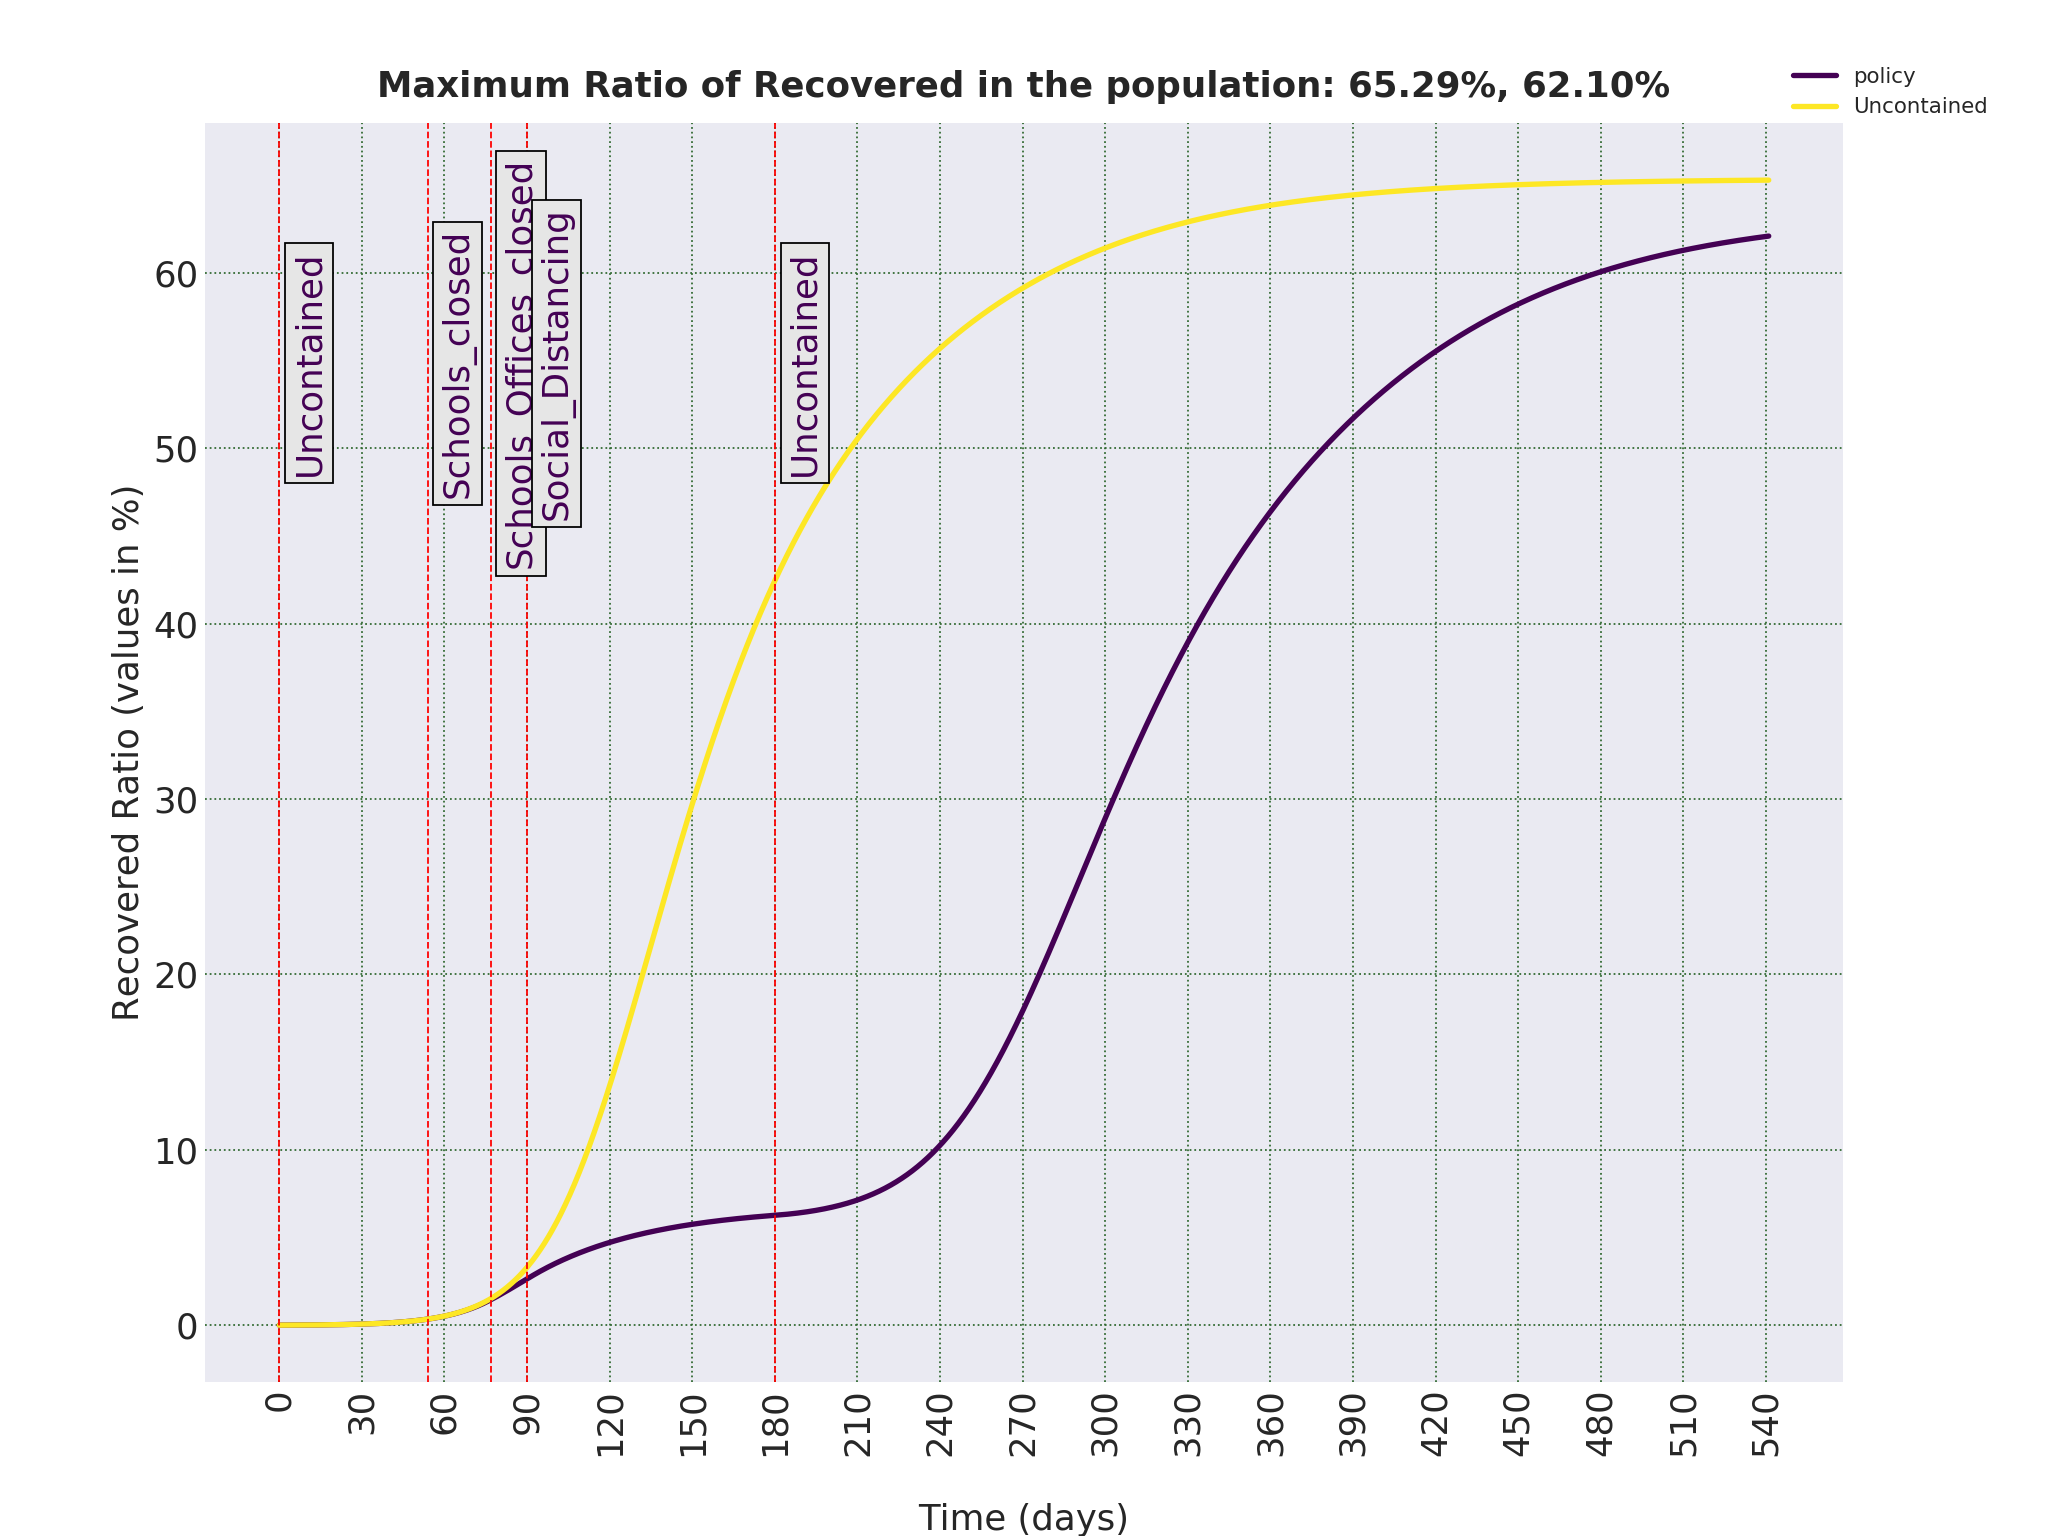
Let’s see what happens if we stop imposing social distancing as a way of life before the virus is eradicated. Let’s assume, people of Iran self-impose this policy for only three months, and after that, human interactions go back to the levels that were in their normal lifestyle. As shown in the figures, ratio of Infectious starts to increase, although the peak is now down to 7.54% and happens in Day 290, a few months delay compared to 135 days in uncontained scenario. But as can be seen in Figure 0.2, the eventual number of Removed, hence the eventual death toll would be more or less the same. In other words, to stop this disease to eventually infect 65% of the population, we should continue effective containments strategies until there are strong evidence that the disease is completely eradicated or a vaccine is publicly available. This also applies to the next scenario.
———————————————————————————————————————————
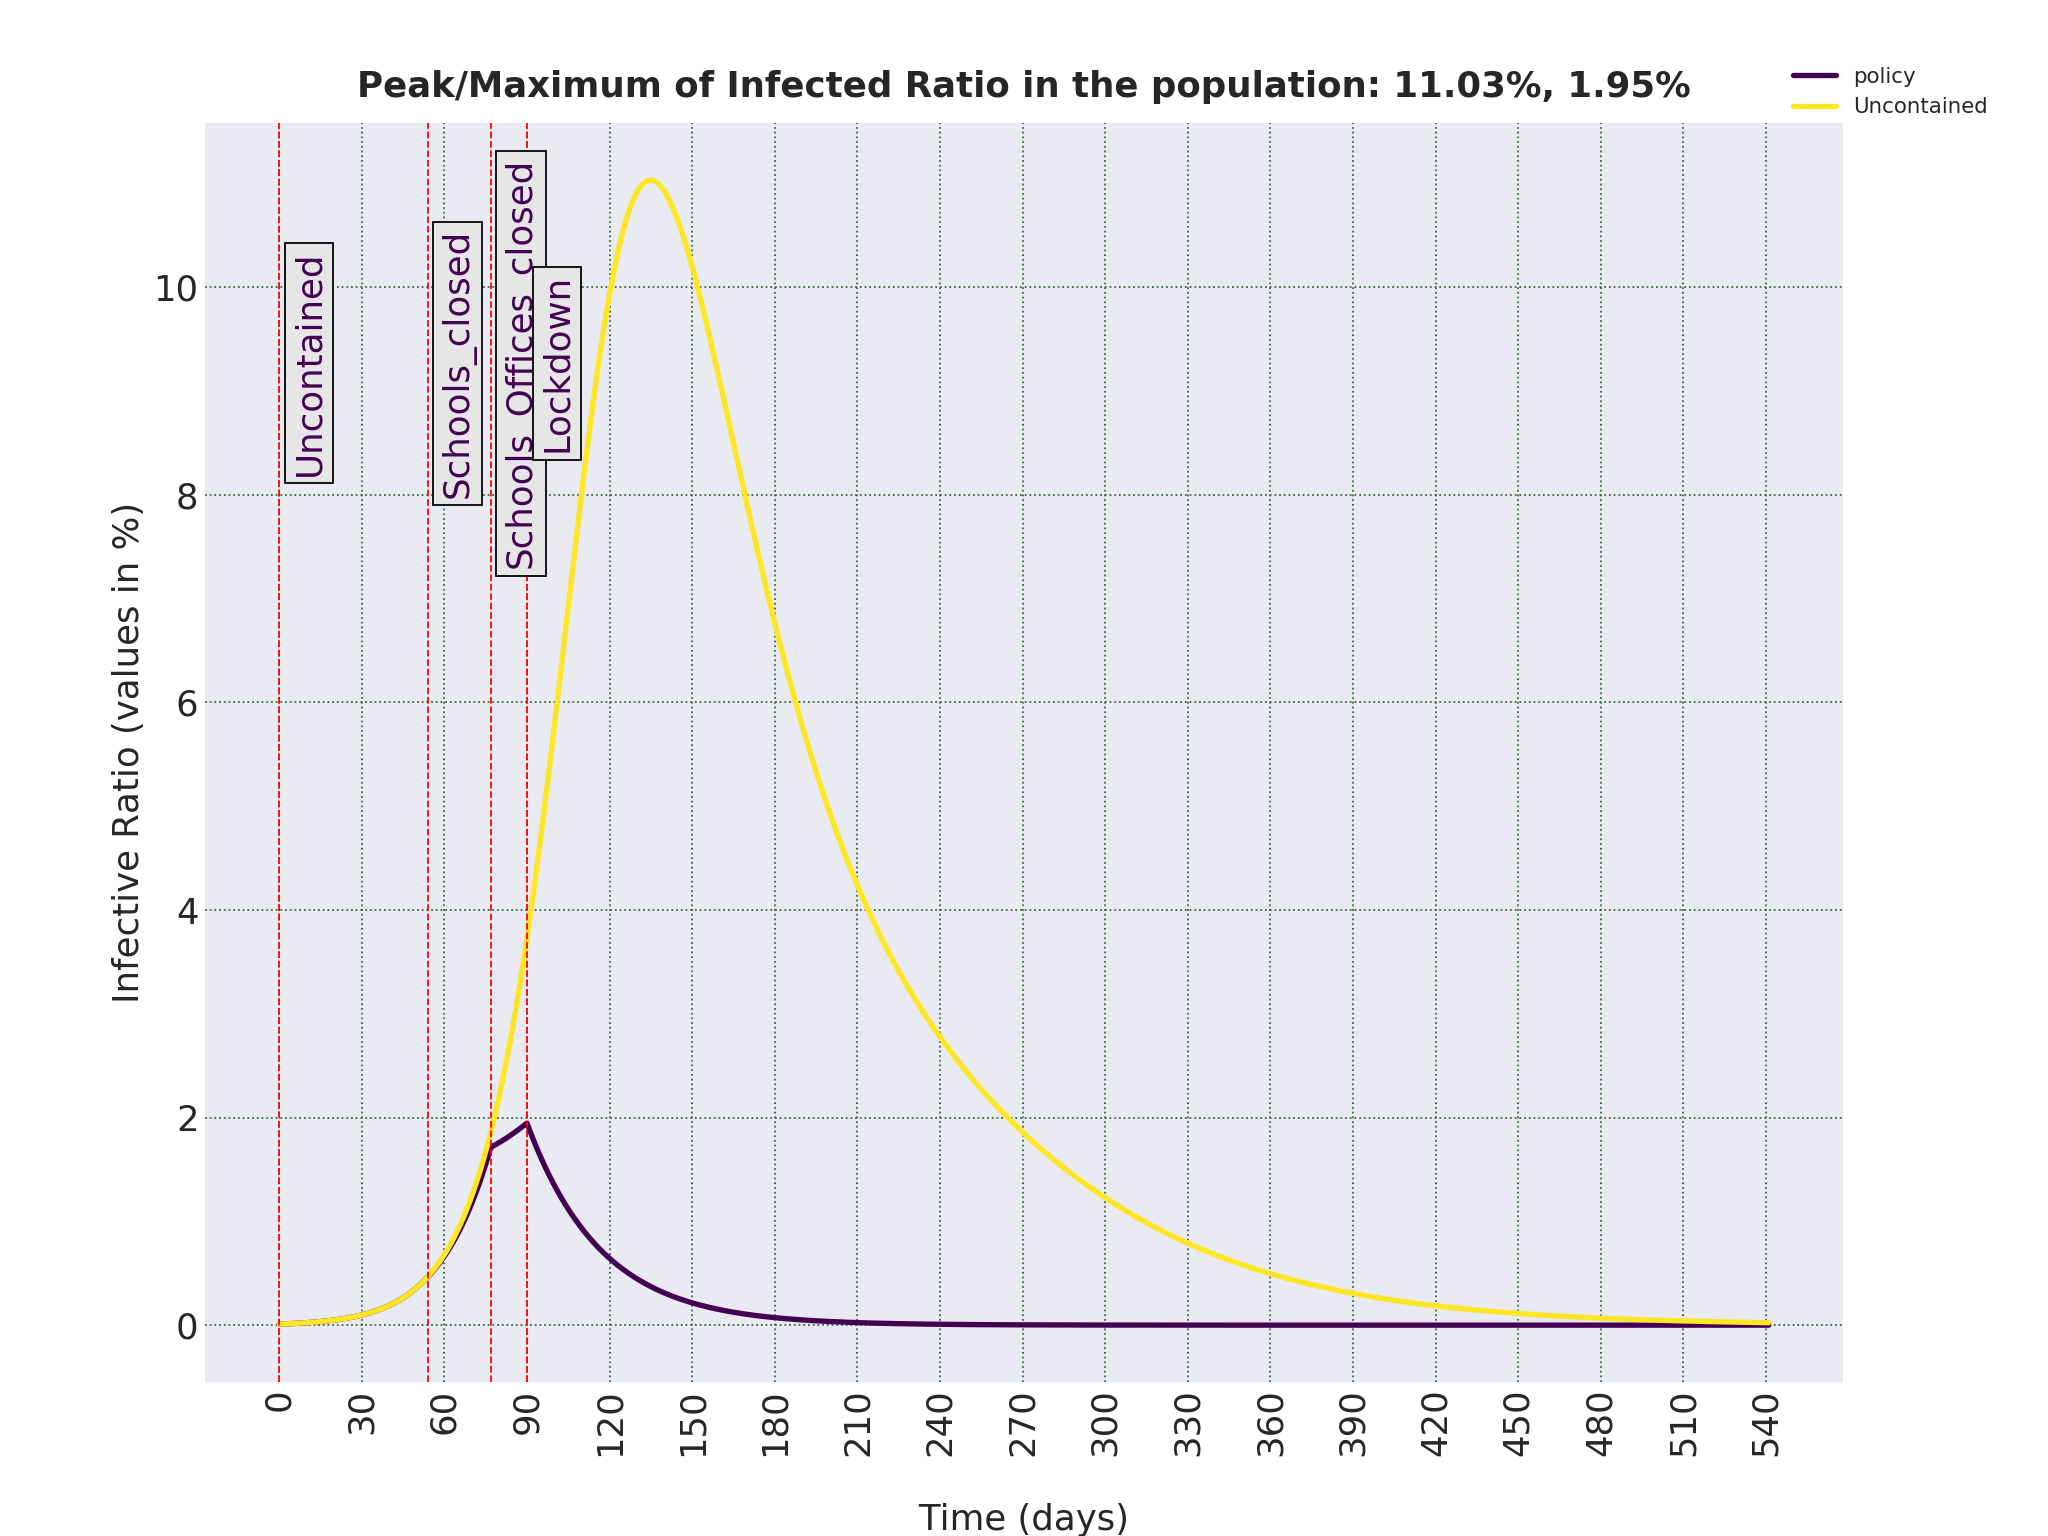
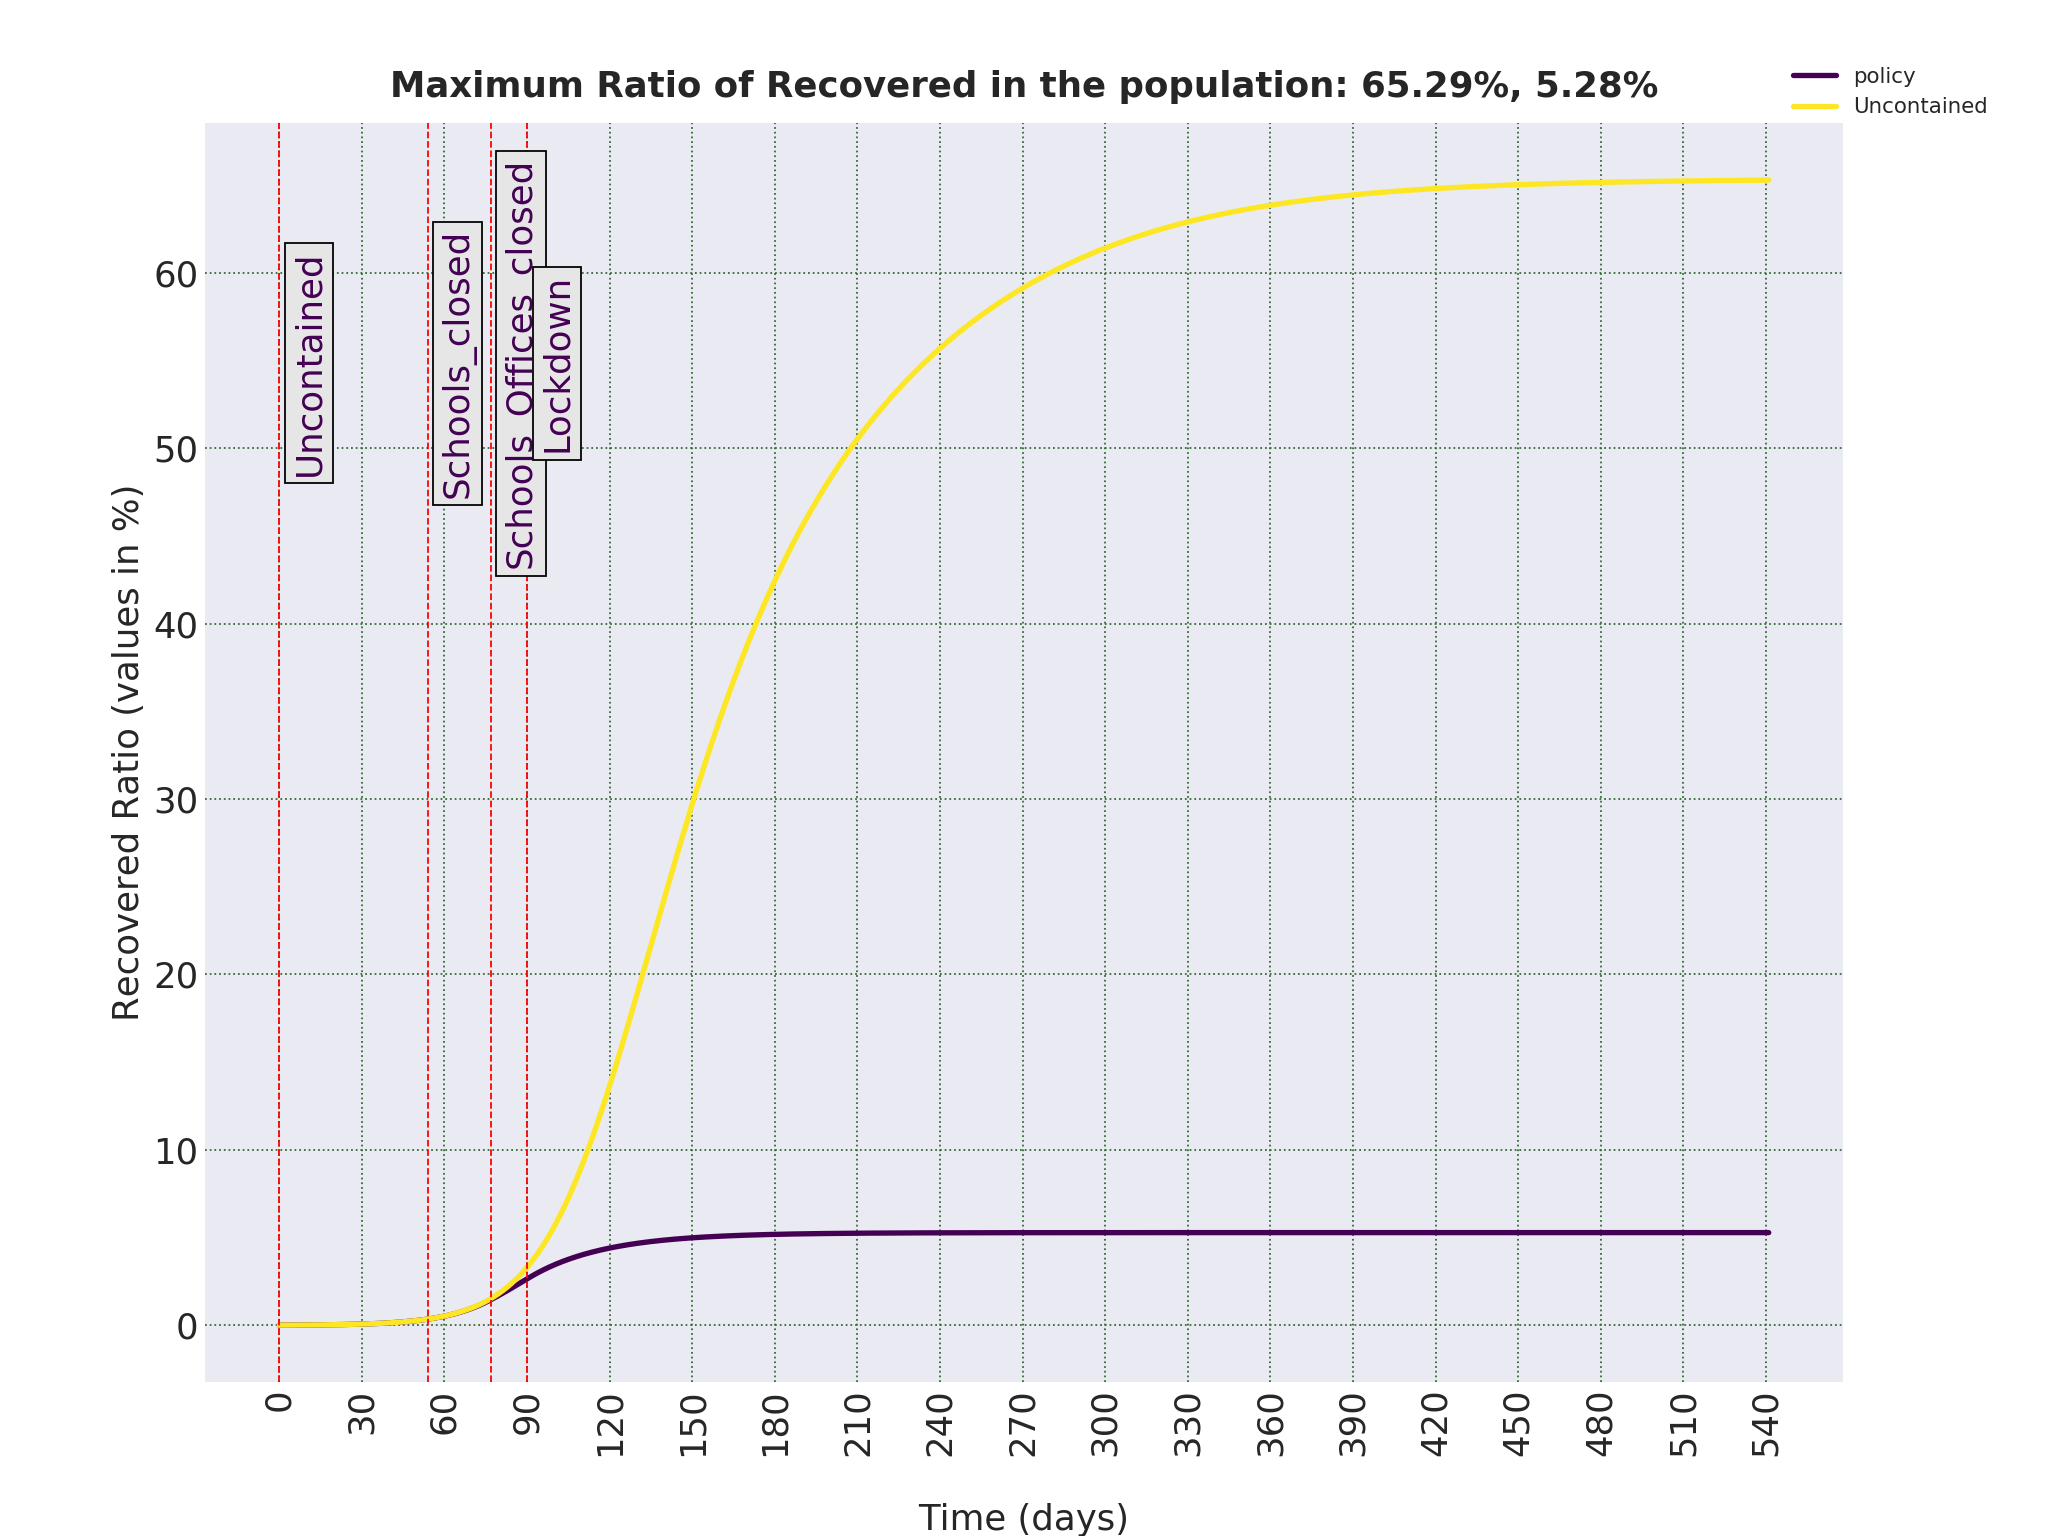
And finally, if an official Lock-down is imposed on the population, governmental offices closed, big gatherings banned and people asked to stay home, similar to what is happening in some countries around the world, the future will look as shown below. In this case, I have assumes a total lock-down means interactions of all the members of the society on average has decreased to only 10% of what it used to be.
Again, given the current number of Infectious, eradicating the disease will take months. But the eventual total number of infected people will be 5.28% of the population, around 4.5 million. With the mortality rate of 0.2%, that means the eventual death toll will be around 9, 000, a significant decrease from 110, 000 in uncontained case. More than a hundred thousand lives can be saved in Iran if such a policy is imposed. And even if merits of such a policy in the long-run can be debated, there is no justification of any sort not to impose such a policy with immediate effect for at least one month.
———————————————————————————————————————————
In the previous section, we saw how different strategies can affect the rate of changes of the number of Infectious people in the population. And we saw that the total lock-down is a necessary strategy when the number of infectious people grow fast and we need to immediately lower the growth rate. Without such policies, Iran, or any other society for that matter, will face a humanitarian disaster, and the whole purpose of this report is to highlight this imminent threat.
But let’s assume that there is an immediate containment policy in place and the number of infected starts to drop. As we saw, bringing down the ratio of infectious to a level that is close to 0 for practical purposes can take months. And imposing a strict containment strategy has a huge economic impact. Apart from that, even if we eradicate the virus in the population, there is always a possibility that it is re-introduced from other countries who have not done so. So, the natural question is, what policy is suitable for a long-term strategy. An obvious answer, is to impose a policy that would to make Basic Reproduction Number, R0, to be around 1.0 (for technical details, please look at this). What kind of policy is needed to achieve that goal? To find the answer to that, we need to run an optimisation scheme to find the coefficients for contact rates in each age groups which would bring R0 from the original estimated 2.28 for the spread of COVID-19 in an uncontained population, to around 1.00.
In the simplest case, when we decide to impose a uniform policy to all age groups, the coefficient is 0.4342. It means that if everybody will bring down their direct contacts with other individuals to 43% of what it was in the normal times, the ratio of infectious would stay the same or decrease at a slow pace. Now let’s see how these values change if we want to impose different policies for each age groups. To make it realistic, I have assumed a different policy for people under 20, between 20 and 70, as the workforce in the society, and above 70. And let’s assume minimum feasible coefficient is 10% for all age groups. Running the optimisation scheme again, we get values of [0.1101, 0.1954, 0.9026] for these three age groups, 0-20, 20-70, and 70+. []Technical note: the optimisation problem is non-convex, and I use a global optimisation algorithms to solve it. Algorithm, which is sqp in Global Optimization Toolbox in Matlab©, find different local minima in different runs. A more sophisticated algorithm might be needed]. But bringing down the interactions of the working force to 19.5% of the normal level while asking elderly to bring it down only to 90% does not seem like a sound policy. Let’s set a lower threshold of 40% to the interactions of the working force and keep it at 10% for other two age ranges. Also, to protect the elderly, who are the most vulnerable age group with the highest mortality rates, we set an upper limit of 20% on their interactions. In other words, we ask them to, until further notice, lower their interactions with other people considerably. The optimised coefficients are now [0.3812, 0.5481, 0.1998]. So, under such a policy, if kids and teenagers’ interactions are brought down to 38% and adults to 54%, number of Infectious would stay more or less the same for a long period of time.
Last updated on November 8, 2020.